WNPS user's guide
This is a brief user’s guide of the Wind Noise Prediction Software (WNPS). This project aimed to predict the wind noise propagation paths of the holes & gaps and provide guidance for the development of wind noise performance on the early stage. Machine learning and data science techniques are adopted to analysis former experimental data and conduct the prediction. Refer to the project developing report for all the details.
1. Introduction
This section gives an overview of Wind Noise Prediction Software (WNPS), its purpose, features, and benefits. It also provides some background information on the project development process and the intended audience of the guide. A glossary part is followed including terms or acronyms that could help users to understand the technical aspects of WNPS better.
1.1. Overview
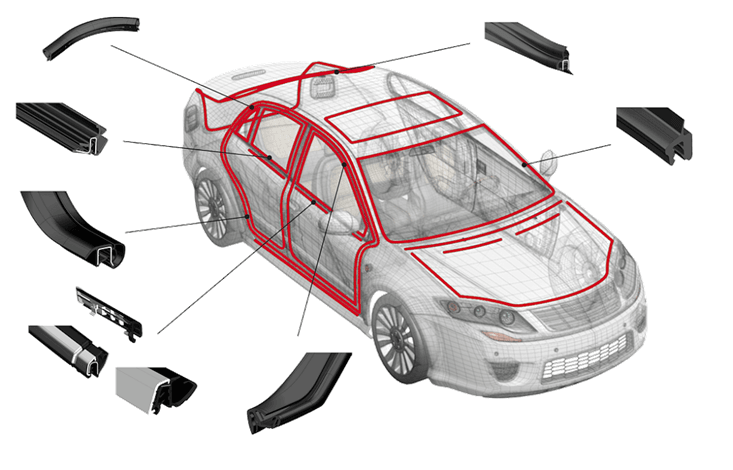
WNPS is a cross-platform software product that predicts the wind noise propagation paths of the holes and gaps in a vehicle and provides guidance for the development of wind noise performance on the early stage. Wind noise is a type of noise that is generated by air flow around a vehicle and can affect its acoustic comfort and quality[1] [2]. WNPS uses machine learning and data science techniques to analyze former experimental data and conduct the prediction[3].
WNPS has the following features and benefits:
- It can read the basic data of the experiment vehicle, such as vehicle type, height, width, length, configuration and status[3]
- It can output a relative ML predicted AI (Articulation Index) value that indicates the intelligibility of speech in noisy environments[4]
- It can print a line chart that shows how different experiment statuses affect the AI value[3]
- It can help engineers to optimize the design of vehicles for better wind noise performance
The intended audience of this guide are engineers who are involved in vehicle design, testing and evaluation. This guide assumes that they have some basic knowledge of wind noise, machine learning and data science.
1.2. Glossary
| terms | explanation |
|---|---|
| AI | Articulation Index. A measure of speech intelligibility in noisy environments. The higher the AI value, the more intelligible speech is. |
| ML | Machine Learning. A branch of artificial intelligence that uses algorithms and data to learn from experience and make predictions. |
| R | wheel hub diameter. |
| L | car length |
| W | car width |
| H | car height |
| ESG | Electrically heated safety glass. A type of glass that has an electric heating element embedded in it. |
| VSG | Vacuum safety glass. A type of glass that has a vacuum layer between two sheets of glass. |
| A − pillar | A roof support pillar located on either side of the front windscreen of a car. |
| B − pillar | It is located in the car’s midsection, between the A and C pillars. |
| C − pillar | It holds the sides of your car’s rear window in place. |
| WNPS | Wind Noise Prediction Software. A software product that predicts the wind noise propagation paths of holes and gaps in a vehicle using machine learning techniques. |
| GUI | Graphical User Interface, a visual way of interacting with a software program |
2. Starting and Executing WNPS
This section the describes the requirements of WNPS. It also includes instructions on how to run WNPS on Windows and Linux platform.
2.1 System Requirements
Before you begin, make sure that your computer meets the system requirements for the software:
- Operating System: Windows 10 or Linux
- Processor: Intel Core i5 or equivalent
- Memory: 8 GB RAM
- Storage: 500 MB available space
- Data file (optional): A data file that contains the configuration data in EXCEL format.
2.2 Starting WNPS
To start it in Windows operating system:
Go to directory
Q:\7th_ML_noise_prediction\Platforms\Windouble click on the executable file (image below with blue shade):
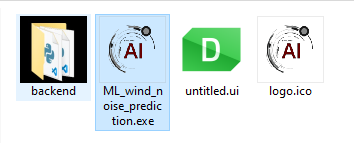
To run it in Linux:
Open a terminal window.
Run the following command:
cd /7th_ML_noise_prediction/Platforms/Linux && ./ML_wind_noise_prediction &
Note that it could take as long as 8 mins to start the app for the first time.
3. Getting started
This section helps you to get familiar with WNPS interface, menus, icons, buttons and other elements. It also include a tutorial or a walkthrough of a common task/scenario using WNPS.
3.1. Graphical User Interface (GUI)
The WNPS interface is designed to be simple and user-friendly, with three main parts: the menu bar, input panel, and output panel.
Part 1: the Menu Bar
The menu bar is located at the top of the WNPS window and provides access to various functions and settings. It contains the following options:
- File: Allows you to open, save, and export files. It also allows you to the start the prediction process.
- Plotting: Allows you to customize the plotting process and the appearance of output panel.
Part 2: the Input Panel
The input panel is located at the bottom half of the WNPS window and is where you can manually enter or select the basic data of your experiment vehicle. The input panel is divided into different sections, such as vehicle type, height, width, length, configuration, and status. Here is a brief description of the sections:
- Vehicle basic information: Allows you to select the type of vehicle you are testing, and its dimension.
- Configuration: Allows you to select the configuration of the vehicle.
- Status: Allows you to enter the status of the experiment.
At the bottom of the input panel, there are two buttons: predict and save data. The predict button starts the prediction process, and the save data button allows you to save the input data as a CSV file.
Part 3: the Output Panel
The output panel is located at the upper half of the WNPS window and displays your prediction results as a point and/or as a line chart. The output panel is divided into two parts: the toolbar and the chart area.
- Toolbar: Allows you to change the chart settings, such as zoom in/out, pan, and switch between AI point and line chart.
- Chart area: Displays your prediction results as an AI point and/or as a line chart. The line chart shows how different experiment statuses affect the AI value. The relative (instead of the absolute) AI value is plotted indicates the AI gain/loss compared with the last status.
Here is an example screenshot of WNPS interface:
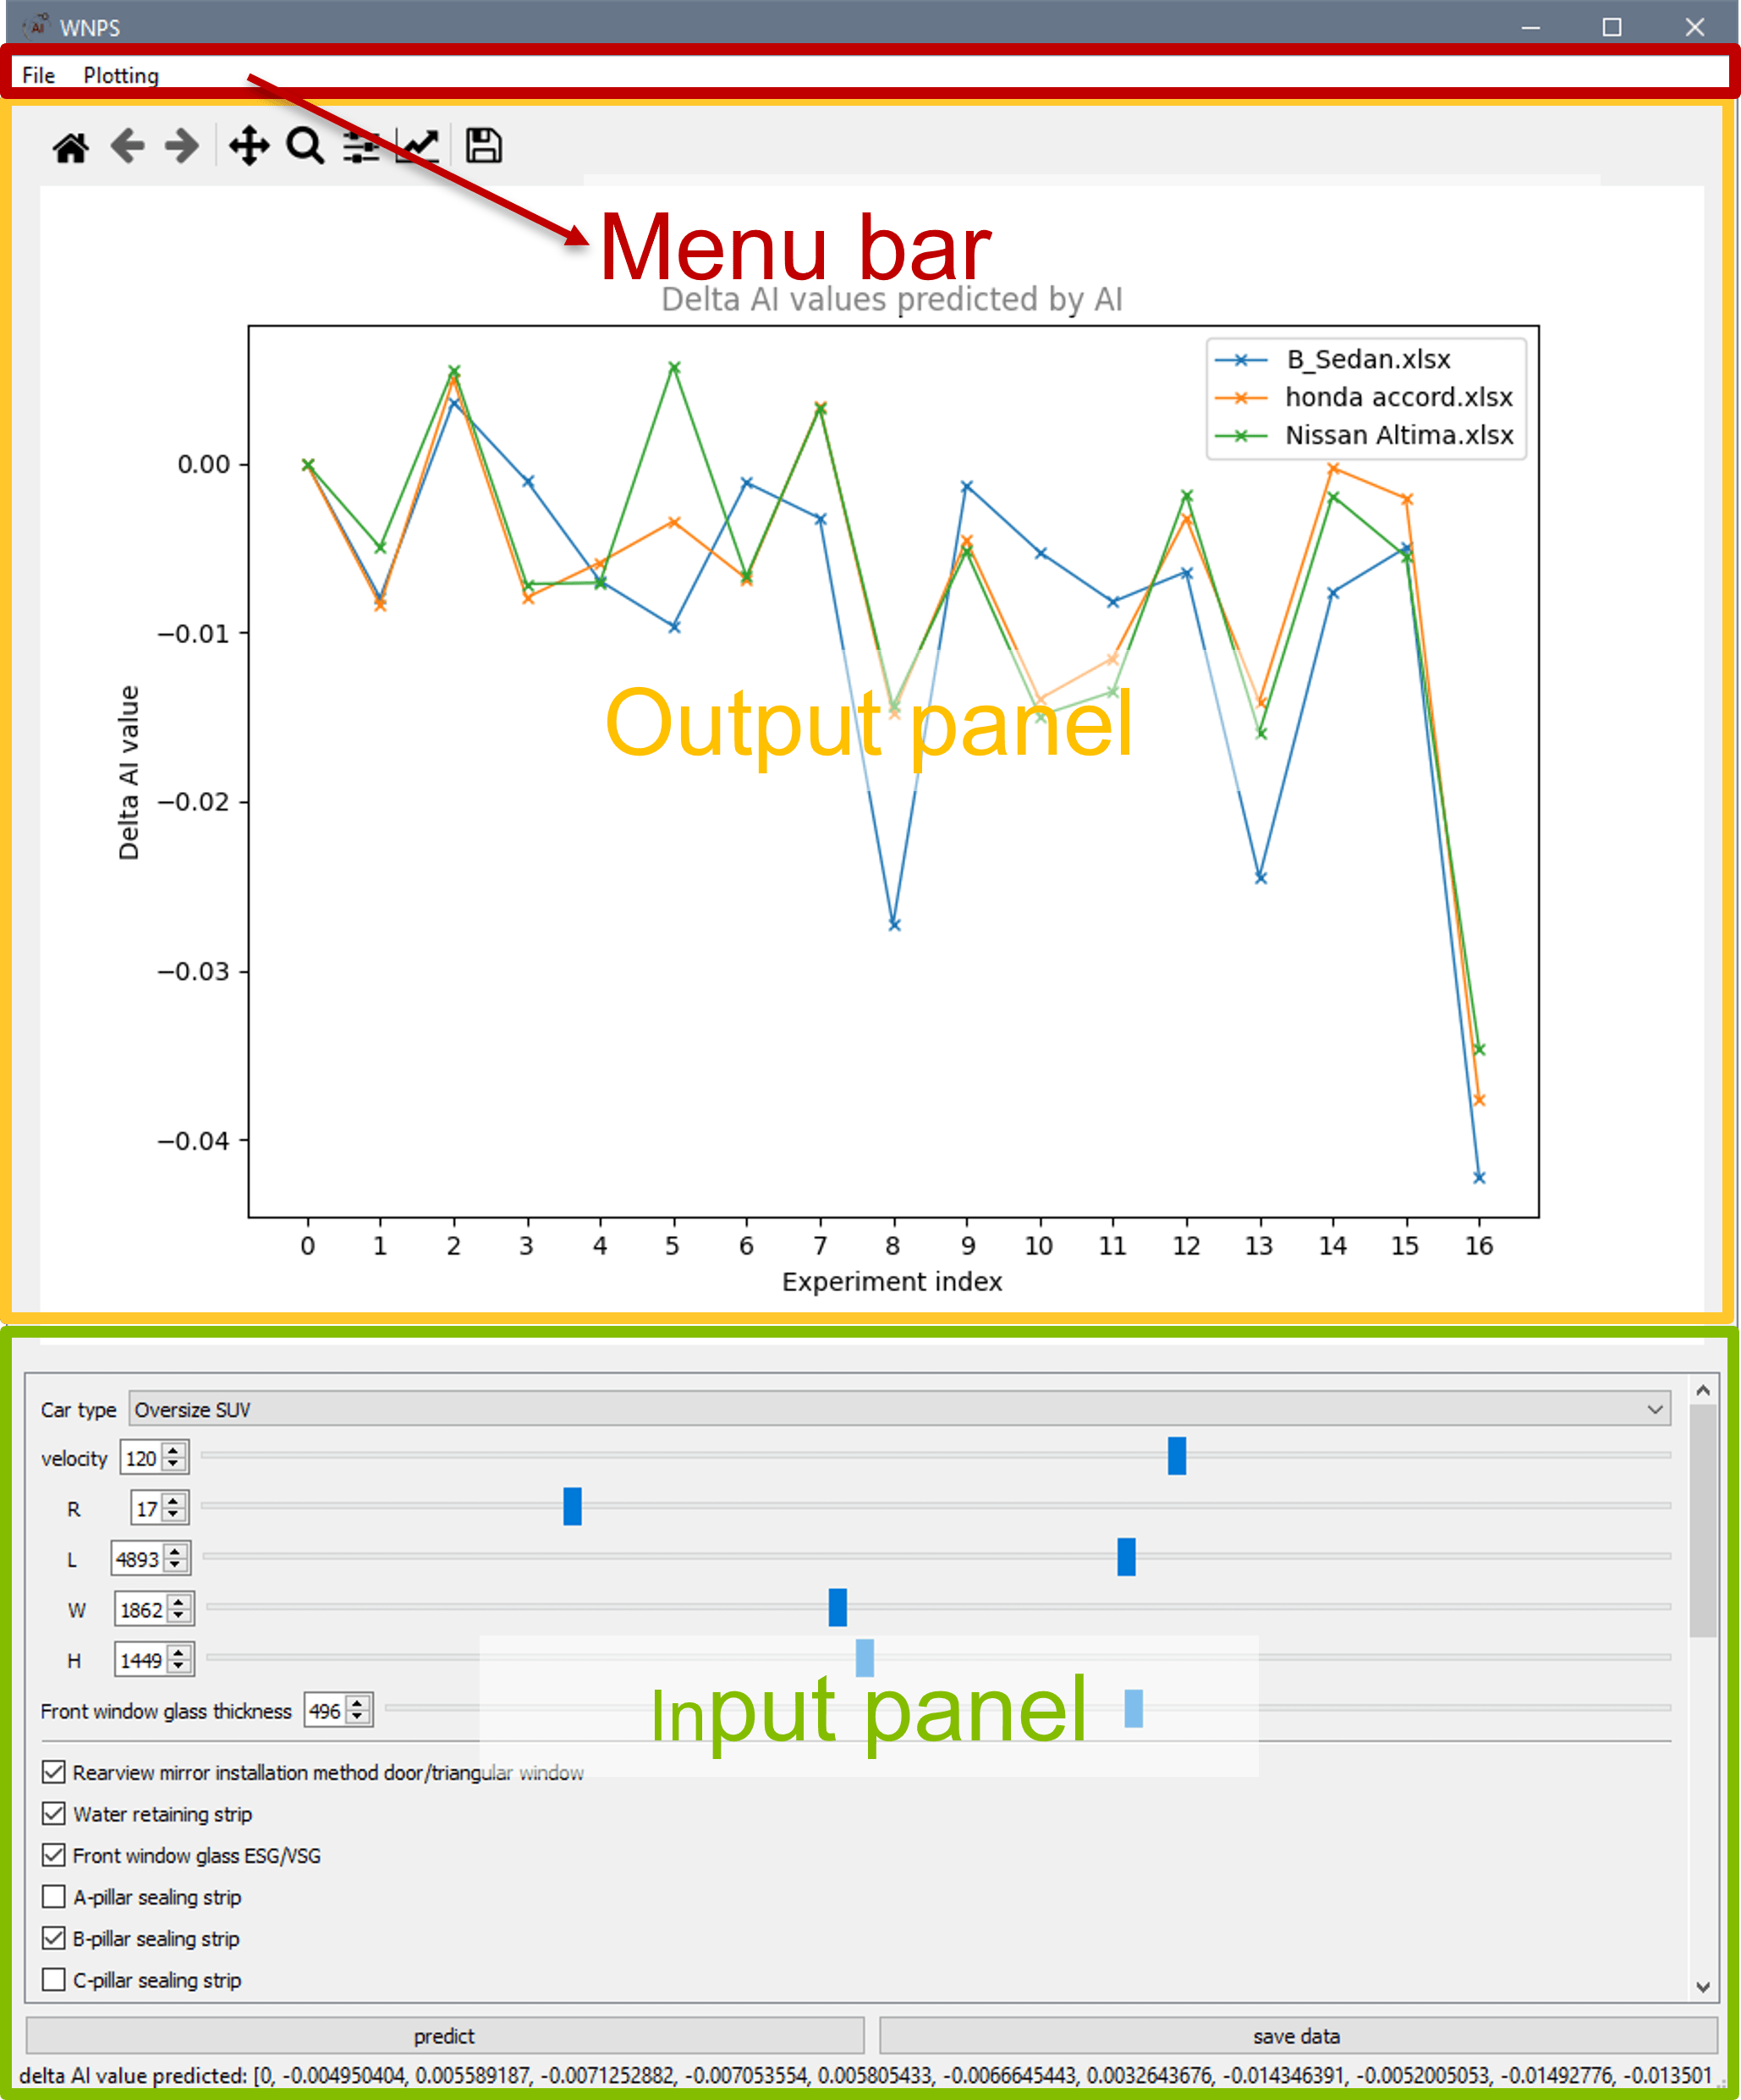
The menu bar provides quick access to different functions and settings, while the input panel allows you to easily enter or select the basic data of your experiment vehicle. The output panel displays your prediction results in a clear and concise manner, making it easy to analyze and optimize your vehicle’s wind noise performance.
3.2. Tutorial
This tutorial will guide you through the process of using WNPS to predict wind noise performance and optimize vehicle design. By following these steps, you will be able to input your data, run the prediction process, view your results, and save your data and charts.
Step 1: Enter or select your input data
There are two methods for inputting your data into WNPS. The first method is manual input. This involves typing or choosing your input values from drop-down lists in each field under Input Data section in the input panel. Details will be explained in the manual input section.
The second method is data file input. To use this method, click on
the Predict_from_file button under File
section in the menu bar, and select your EXCEL file that contains your
input data. The file should have one row per experiment status with
columns corresponding to each input field. An example input file is
shown in the file input section.
Step 2: Click on Predict button
Once you have entered or selected your input data, click on the
Predict button at the bottom left corner of the input panel
to start the prediction process.
Step 3: View your prediction results
After the prediction process is complete, you will be able to view your results in the output panel. Depending on your input data, you will see a new point or a line chart. The line chart shows how different experiment statuses affect the AI value. The relative (instead of the absolute) AI value is plotted, which indicates the AI gain/loss compared with the last status.
Step 4: Add a new line
If you want to add a new line to your input data, press the
new_line button under the Plotting section on
the menu bar, and then go back to step 1 to enter more data.
Step 5: Save your results
You can save your result as a data (CSV) file by clicking on the
save data button at the bottom right corner of the input
panel. You can also save the line chart by clicking on the
save_image button under the plotting section on the menu
bar, or clicking on the icon: save button on the output
panel toolbar.
4. Using WNPS
This section explains how to perform various functions and operations using WNPS in detail. It provides tips, tricks and best practices for using WNPS effectively.
4.1 Manual input
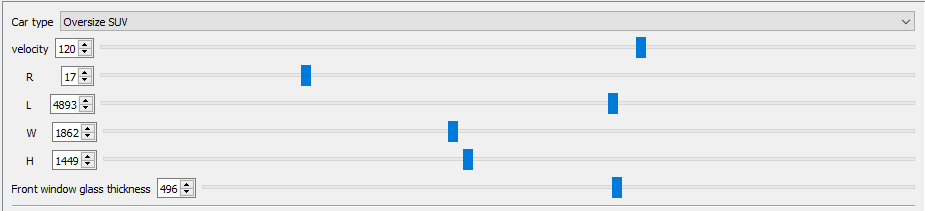
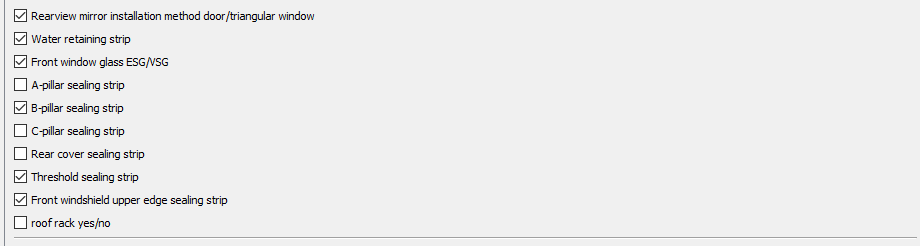
The input panel of the Wind Noise Prediction Software (WNPS) is a crucial component of the software that enables engineers to perform virtual experiments to predict wind noise propagation paths in a vehicle. It contains three distinct subsections that enable users to input critical information about the vehicle being tested, wind-noise related configurations, and experiment status.
The first subsection, Basic Info, enables users to input information about the vehicle being tested, such as its type, dimensions, and other basic data. The Wind-Noise Related Configurations subsection allows the user to specify design details that could affect the vehicle’s wind noise performance, such as hole size and shape, gap width, and vehicle configuration. The Experiment Status subsection allows the user to toggle between different settings for each virtual experiment.
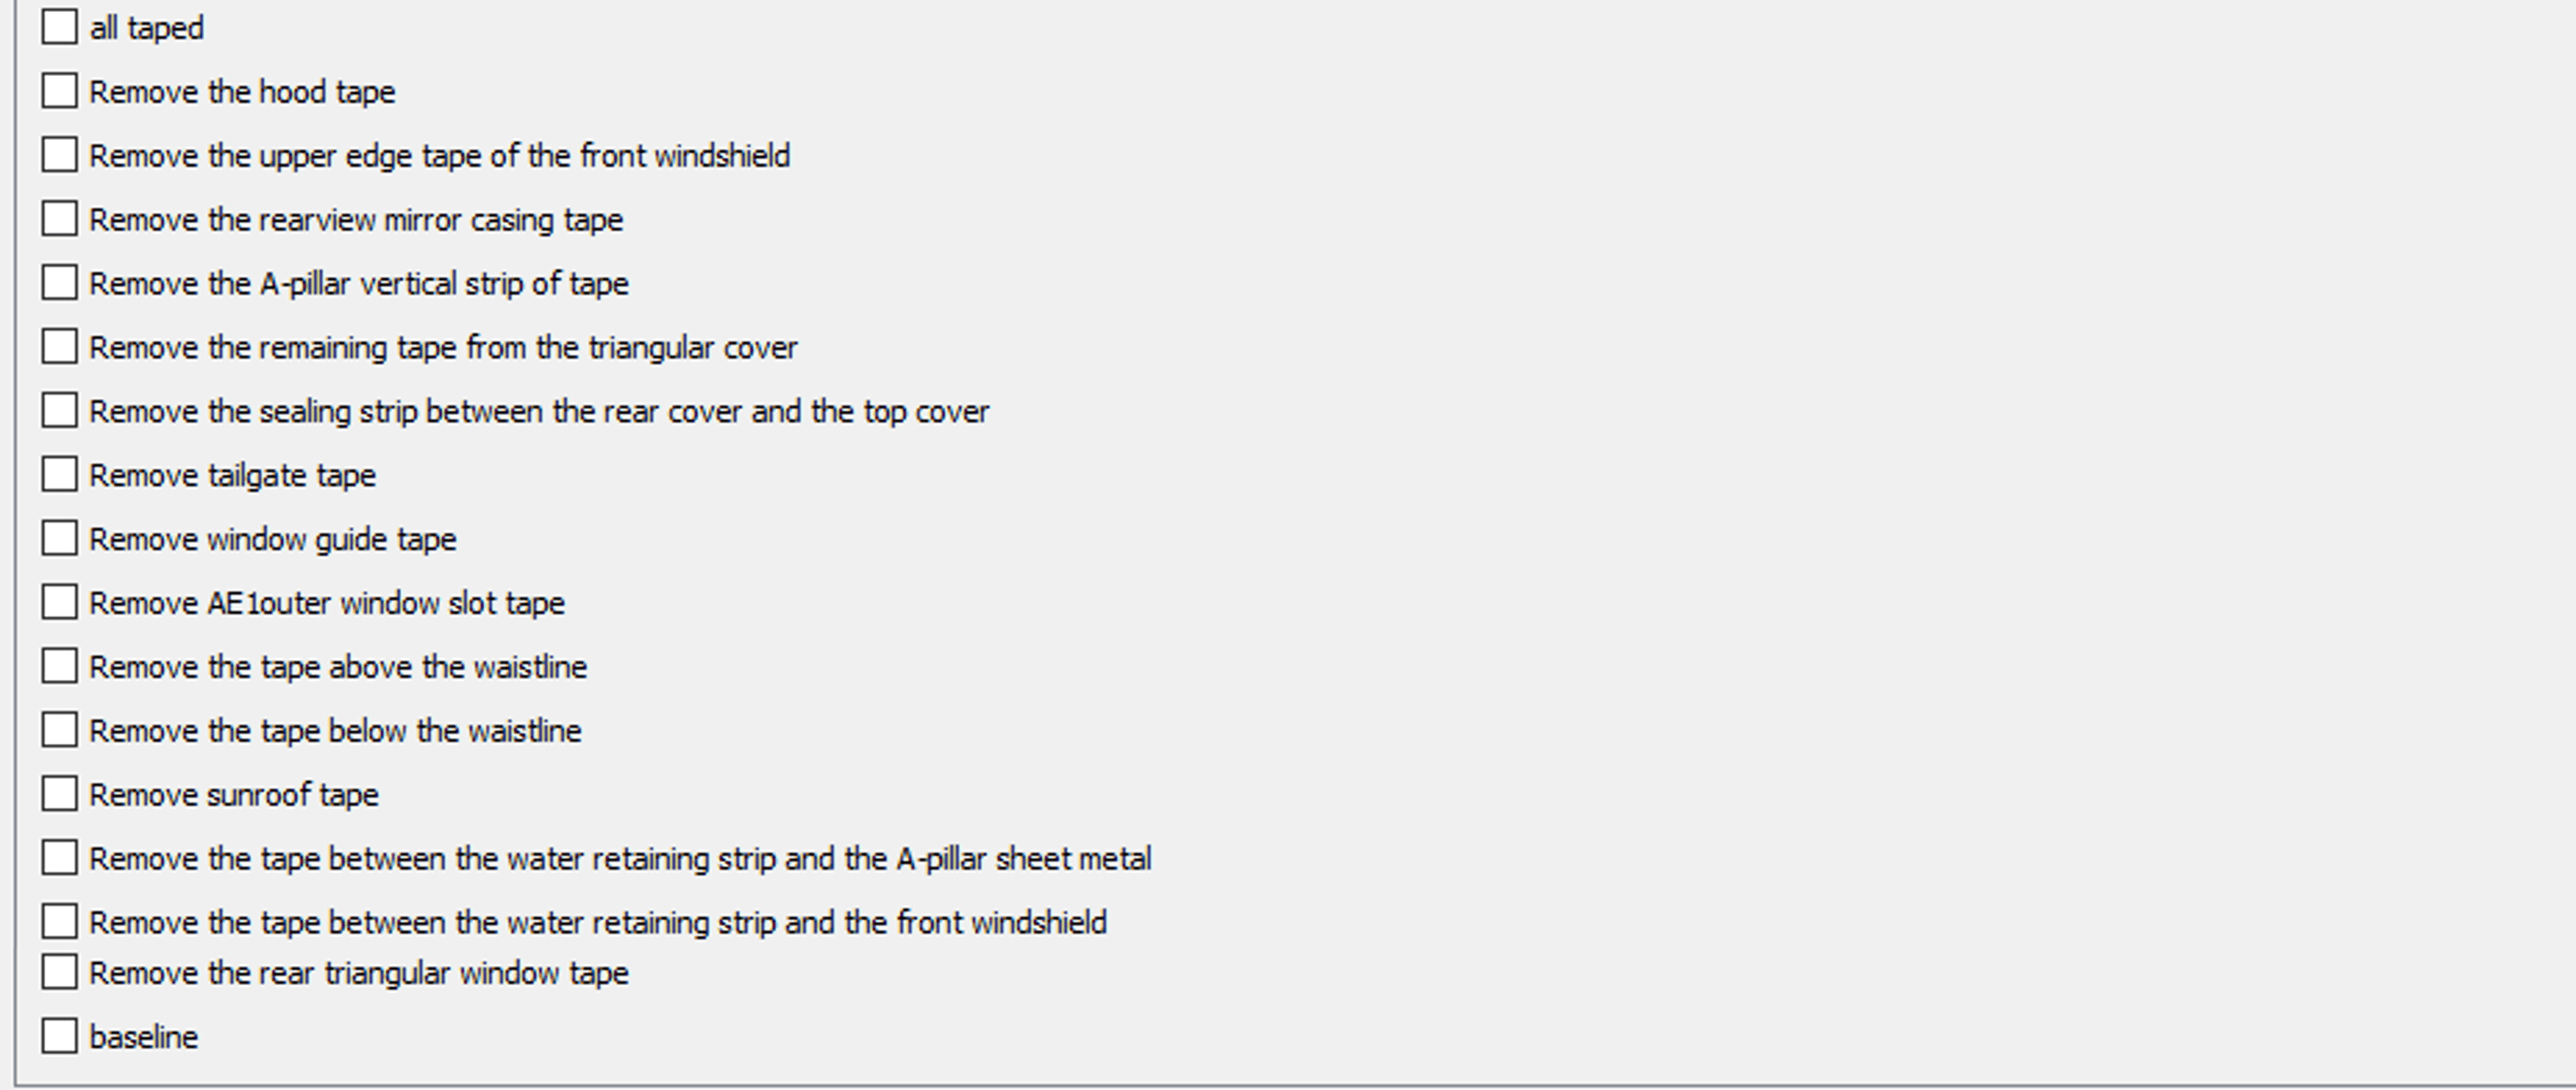
The input panel is designed to make it easy for engineers to perform a series of experiments on a vehicle quickly. If they are performing a series of experiments at a single velocity to generate one AI line, they can set the first two subsections only once. They can then toggle the checkboxes under the third subsection several times to correspond with each virtual experiment, saving time and simplifying the process.
The Experiment Status subsection of the input panel is particularly useful because it enables engineers to quickly toggle between different settings for each virtual experiment. This means they can test multiple configurations in a short amount of time, without manually inputting all of the information again.
| Input panel subsections | notes |
|---|---|
 |
basic info |
 |
wind-noise related configurations |
 |
experiments status |
In summary, the input panel of WNPS streamlines the process of performing virtual wind noise experiments and helps engineers make informed decisions about vehicle design. Its user-friendly interface enables engineers to input the necessary information quickly and easily, and the Experiment Status subsection allows them to test multiple configurations efficiently.
4.2. File input
The input file of the Wind Noise Prediction Software (WNPS) is another way for engineers to perform virtual experiments. It offers a convenient way to perform multiple virtual experiments at once, by allowing users to specify all the necessary information in a single file. As shown below, the file is organized into three sections: basic data, wind noise related configurations, and experiment status. Each row in the input file represents one experiment, and each file results in one series of experiments (one line).
| A | B | C | D | E | F | G | H | I | J | K | L | M | N | O | P | Q | R | S | T | U | V | W | X | Y | Z | AA | AB | AC | AD | AE | AF | AG | AH | AI | |
|---|---|---|---|---|---|---|---|---|---|---|---|---|---|---|---|---|---|---|---|---|---|---|---|---|---|---|---|---|---|---|---|---|---|---|---|
| 0 | basic data | wind noise related configurations | basic | experiment status | |||||||||||||||||||||||||||||||
| 1 | Cartype | R | L | W | H | Rearview mirror installation method door/triangular window | Water retaining strip | Front window glass ESG/VSG | Front window glass thickness | A-pillar sealing strip | B-pillar sealing strip | C-pillar sealing strip | Rear cover sealing strip | Threshold sealing strip | Front windshield upper edge sealing strip | roof rack yes/no | velocity | all taped | Remove the hood tape | Remove the upper edge tape of the front windshield | Remove the rearview mirror casing tape | Remove the A-pillar vertical strip of tape | Remove the remaining tape from the triangular cover | Remove the sealing strip between the rear cover and the top cover | Remove tailgate tape | Remove window guide tape | Remove AE1outer window slot tape | Remove the tape above the waistline | Remove the tape below the waistline | Remove sunroof tape | Remove the tape between the water retaining strip and the A-pillar sheet metal | Remove the tape between the water retaining strip and the front windshield | Remove the rear triangular window tape | baseline | Delta AI Value |
| 2 | 7 | 17 | 4893 | 1862 | 1449 | 1 | 1 | 1 | 4.96 | 0 | 1 | 0 | 0 | 1 | 1 | 0 | 120 | 1 | 0 | 0 | 0 | 0 | 0 | 0 | 0 | 0 | 0 | 0 | 0 | 0 | 0 | 0 | 0 | 0 | 0 |
| 3 | 7 | 17 | 4893 | 1862 | 1449 | 1 | 1 | 1 | 4.96 | 0 | 1 | 0 | 0 | 1 | 1 | 0 | 120 | 0 | 1 | 0 | 0 | 0 | 0 | 0 | 0 | 0 | 0 | 0 | 0 | 0 | 0 | 0 | 0 | 0 | 0 |
| 4 | 7 | 17 | 4893 | 1862 | 1449 | 1 | 1 | 1 | 4.96 | 0 | 1 | 0 | 0 | 1 | 1 | 0 | 120 | 0 | 1 | 1 | 0 | 0 | 0 | 0 | 0 | 0 | 0 | 0 | 0 | 0 | 0 | 0 | 0 | 0 | 0 |
| 5 | 7 | 17 | 4893 | 1862 | 1449 | 1 | 1 | 1 | 4.96 | 0 | 1 | 0 | 0 | 1 | 1 | 0 | 120 | 0 | 1 | 1 | 1 | 0 | 0 | 0 | 0 | 0 | 0 | 0 | 0 | 0 | 0 | 0 | 0 | 0 | 0 |
| 6 | 7 | 17 | 4893 | 1862 | 1449 | 1 | 1 | 1 | 4.96 | 0 | 1 | 0 | 0 | 1 | 1 | 0 | 120 | 0 | 1 | 1 | 1 | 1 | 0 | 0 | 0 | 0 | 0 | 0 | 0 | 0 | 0 | 0 | 0 | 0 | 0 |
| 7 | 7 | 17 | 4893 | 1862 | 1449 | 1 | 1 | 1 | 4.96 | 0 | 1 | 0 | 0 | 1 | 1 | 0 | 120 | 0 | 1 | 1 | 1 | 1 | 1 | 0 | 0 | 0 | 0 | 0 | 0 | 0 | 0 | 0 | 0 | 0 | 0 |
| 8 | 7 | 17 | 4893 | 1862 | 1449 | 1 | 1 | 1 | 4.96 | 0 | 1 | 0 | 0 | 1 | 1 | 0 | 120 | 0 | 1 | 1 | 1 | 1 | 1 | 1 | 0 | 0 | 0 | 0 | 0 | 0 | 0 | 0 | 0 | 0 | 0 |
| 9 | 7 | 17 | 4893 | 1862 | 1449 | 1 | 1 | 1 | 4.96 | 0 | 1 | 0 | 0 | 1 | 1 | 0 | 120 | 0 | 1 | 1 | 1 | 1 | 1 | 1 | 1 | 0 | 0 | 0 | 0 | 0 | 0 | 0 | 0 | 0 | 0 |
| 10 | 7 | 17 | 4893 | 1862 | 1449 | 1 | 1 | 1 | 4.96 | 0 | 1 | 0 | 0 | 1 | 1 | 0 | 120 | 0 | 1 | 1 | 1 | 1 | 1 | 1 | 1 | 1 | 0 | 0 | 0 | 0 | 0 | 0 | 0 | 0 | 0 |
| 11 | 7 | 17 | 4893 | 1862 | 1449 | 1 | 1 | 1 | 4.96 | 0 | 1 | 0 | 0 | 1 | 1 | 0 | 120 | 0 | 1 | 1 | 1 | 1 | 1 | 1 | 1 | 1 | 1 | 0 | 0 | 0 | 0 | 0 | 0 | 0 | 0 |
| 12 | 7 | 17 | 4893 | 1862 | 1449 | 1 | 1 | 1 | 4.96 | 0 | 1 | 0 | 0 | 1 | 1 | 0 | 120 | 0 | 1 | 1 | 1 | 1 | 1 | 1 | 1 | 1 | 1 | 1 | 0 | 0 | 0 | 0 | 0 | 0 | 0 |
| 13 | 7 | 17 | 4893 | 1862 | 1449 | 1 | 1 | 1 | 4.96 | 0 | 1 | 0 | 0 | 1 | 1 | 0 | 120 | 0 | 1 | 1 | 1 | 1 | 1 | 1 | 1 | 1 | 1 | 1 | 1 | 0 | 0 | 0 | 0 | 0 | 0 |
| 14 | 7 | 17 | 4893 | 1862 | 1449 | 1 | 1 | 1 | 4.96 | 0 | 1 | 0 | 0 | 1 | 1 | 0 | 120 | 0 | 1 | 1 | 1 | 1 | 1 | 1 | 1 | 1 | 1 | 1 | 1 | 1 | 0 | 0 | 0 | 0 | 0 |
| 15 | 7 | 17 | 4893 | 1862 | 1449 | 1 | 1 | 1 | 4.96 | 0 | 1 | 0 | 0 | 1 | 1 | 0 | 120 | 0 | 1 | 1 | 1 | 1 | 1 | 1 | 1 | 1 | 1 | 1 | 1 | 1 | 1 | 0 | 0 | 0 | 0 |
| 16 | 7 | 17 | 4893 | 1862 | 1449 | 1 | 1 | 1 | 4.96 | 0 | 1 | 0 | 0 | 1 | 1 | 0 | 120 | 0 | 1 | 1 | 1 | 1 | 1 | 1 | 1 | 1 | 1 | 1 | 1 | 1 | 1 | 1 | 0 | 0 | 0 |
| 17 | 7 | 17 | 4893 | 1862 | 1449 | 1 | 1 | 1 | 4.96 | 0 | 1 | 0 | 0 | 1 | 1 | 0 | 120 | 0 | 1 | 1 | 1 | 1 | 1 | 1 | 1 | 1 | 1 | 1 | 1 | 1 | 1 | 1 | 1 | 0 | 0 |
| 18 | 7 | 17 | 4893 | 1862 | 1449 | 1 | 1 | 1 | 4.96 | 0 | 1 | 0 | 0 | 1 | 1 | 0 | 120 | 0 | 1 | 1 | 1 | 1 | 1 | 1 | 1 | 1 | 1 | 1 | 1 | 1 | 1 | 1 | 1 | 1 | 0 |
One real input file should only contains cell A1 to AI18, other cells above are just the notations to the file.
Similar to the manual input panel, the input file contains 3 sections.
The basic data section (Columns A to E and Q ) contains information about the car type, dimensions (length, width and height), and velocity. The
cartypecolumn of the input file specifies the type of vehicle being tested. Different item numbers correspond to different types of vehicles. And the relationship is shown below.item number corresponding cartype 0 oversize SUV 1 Compact SUV 2 Compact Vehicle 3 Mini size vehicle 4 Middle large SUV 5 Middle large vehicle 6 Middle size SUV 7 Middle size Vehicle The wind noise related configurations section (Columns F to P) contains information about rearview mirror installation method, water retaining strip, front window glass type and thickness, sealing strips for various parts of the car (A-pillar, B-pillar, C-pillar and rear cover), whether or not a roof rack is present etc. For True/False configurations, 1 indicates that the design feature is present, while 0 indicates that it is not.
The experiment status section (Columns R to AH ) specifies the removal of tape from different parts of the vehicle during the virtual experiment. With 1 means yes and 0 means no (shaded as green and white for illustration). With 1 representing yes and 0 representing no, each experiment represents a different configuration, and the removal of tapes allows engineers to test the effects of different design choices on wind noise performance.
It is important to note that the Delta AI Value column does not affect the result and can be left at 0 for convenience. After prediction, it is possible to overwrite this column with the predicted value.
For a normal series of virtual experiments, the basic data and wind noise configurations for one vehicle remain unchanged, and the data of columns A to Q remain the same. In the experiment status section (Columns R to AH), the first experiment always tapes all parts of the vehicle, and with each following experiment, one new tape is removed until the last experiment removed all the tapes, representing the baseline status.
For example, in the above example file:
- Experiment 1 (row 2): only cell
R2is checked. - Experiment 2 (row 3): leave
R3as 0 and checkS3indicating that only the hood tape is removed. - Experiment 3 (row 4):
S4,T4are checked indicating that the hood tape remains removed, and a new tape (the upper edge tape of the front windshield) is removed compared with experiment1. - Experiment 4 (row 5):
S5,T5,U5are checked indicating that a new tape (the rearview mirror casing tape) is removed compared with last experiment. - …
- Experiment 17 (row 18):
S18,T18,U18,V18,W18,X18,Y18,Z18,AA18,AB18,AC18,AD18,AE18,AF18,AG18are checked indicating all the tapes are removed, and thereforeAH18is checked indicating the baseline status.
Using the input file, engineers can easily perform virtual experiments to see how different design choices affect wind noise performance. By specifying all the necessary information in a single file, they can quickly generate multiple AI lines and compare wind noise performance across different configurations. Overall, the input file is a powerful tool that streamlines the process of performing virtual wind noise experiments and helps engineers make informed decisions about vehicle design.
4.3. Plotting
The output panel embeds the matplotlib toolbar[5] and buttons, and this embedded version works very much like it. It is very convenient to zoom in/out, change the figure configuration, figure options, legend name, etc.
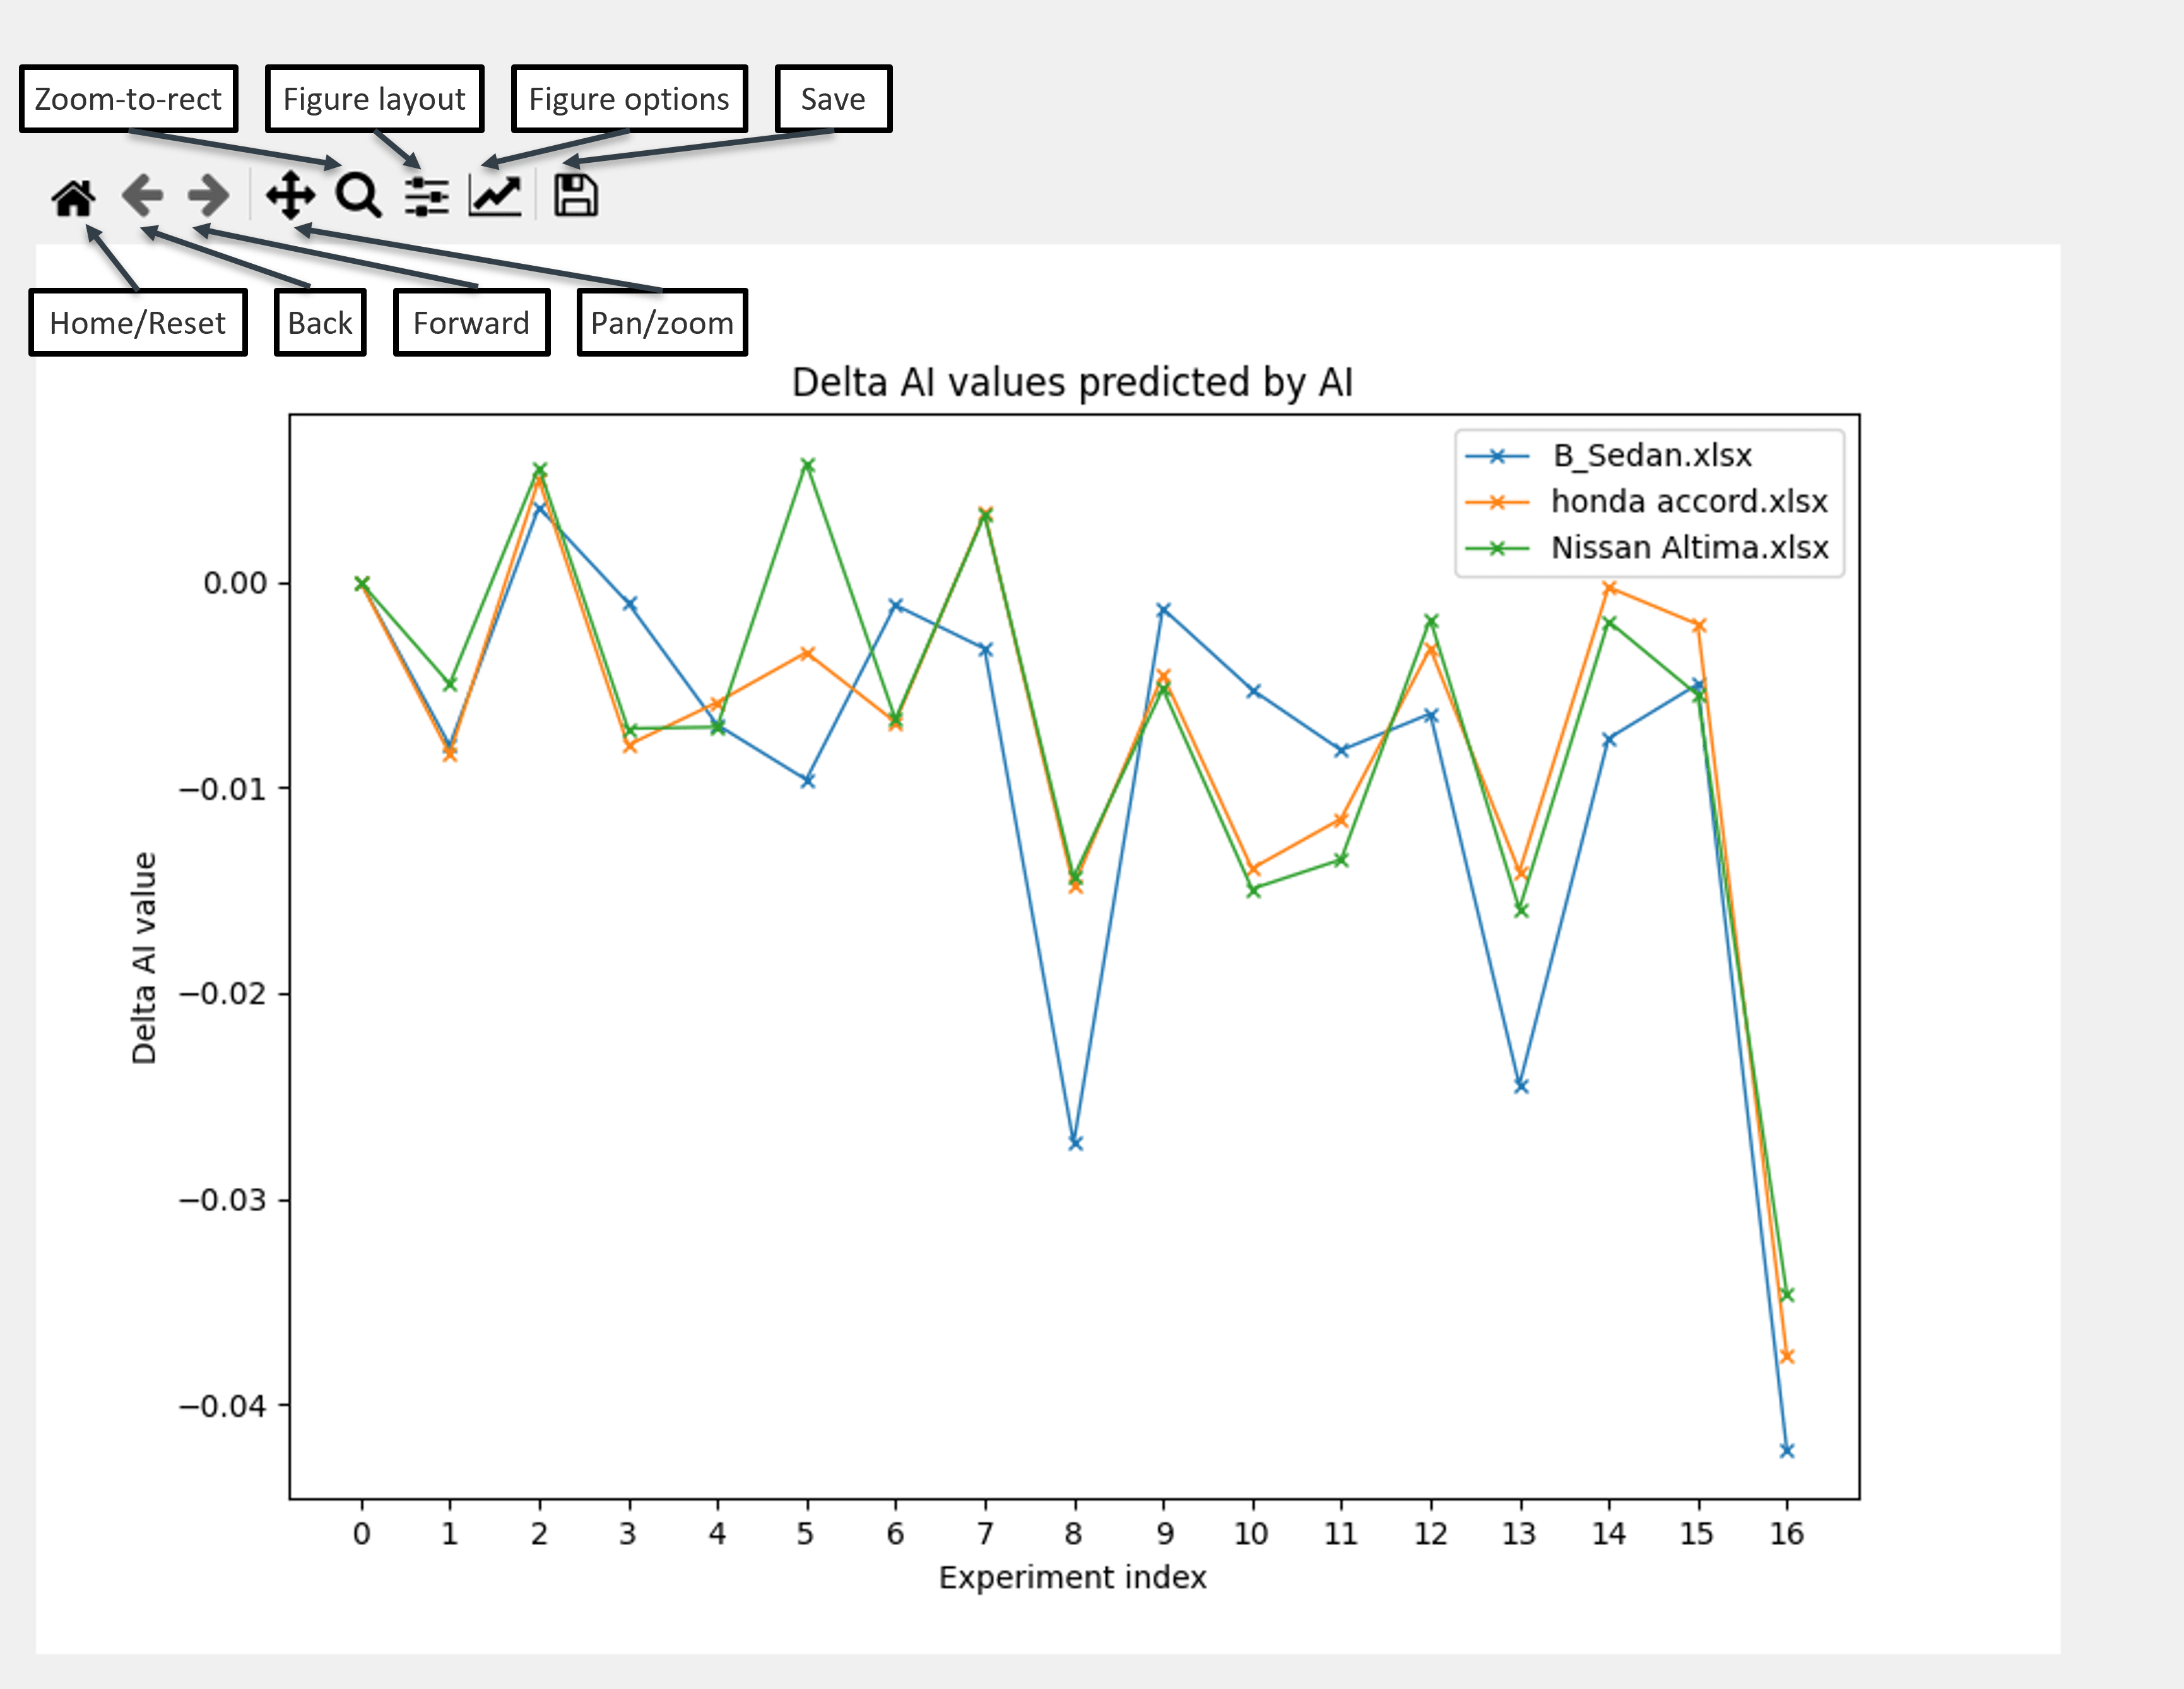
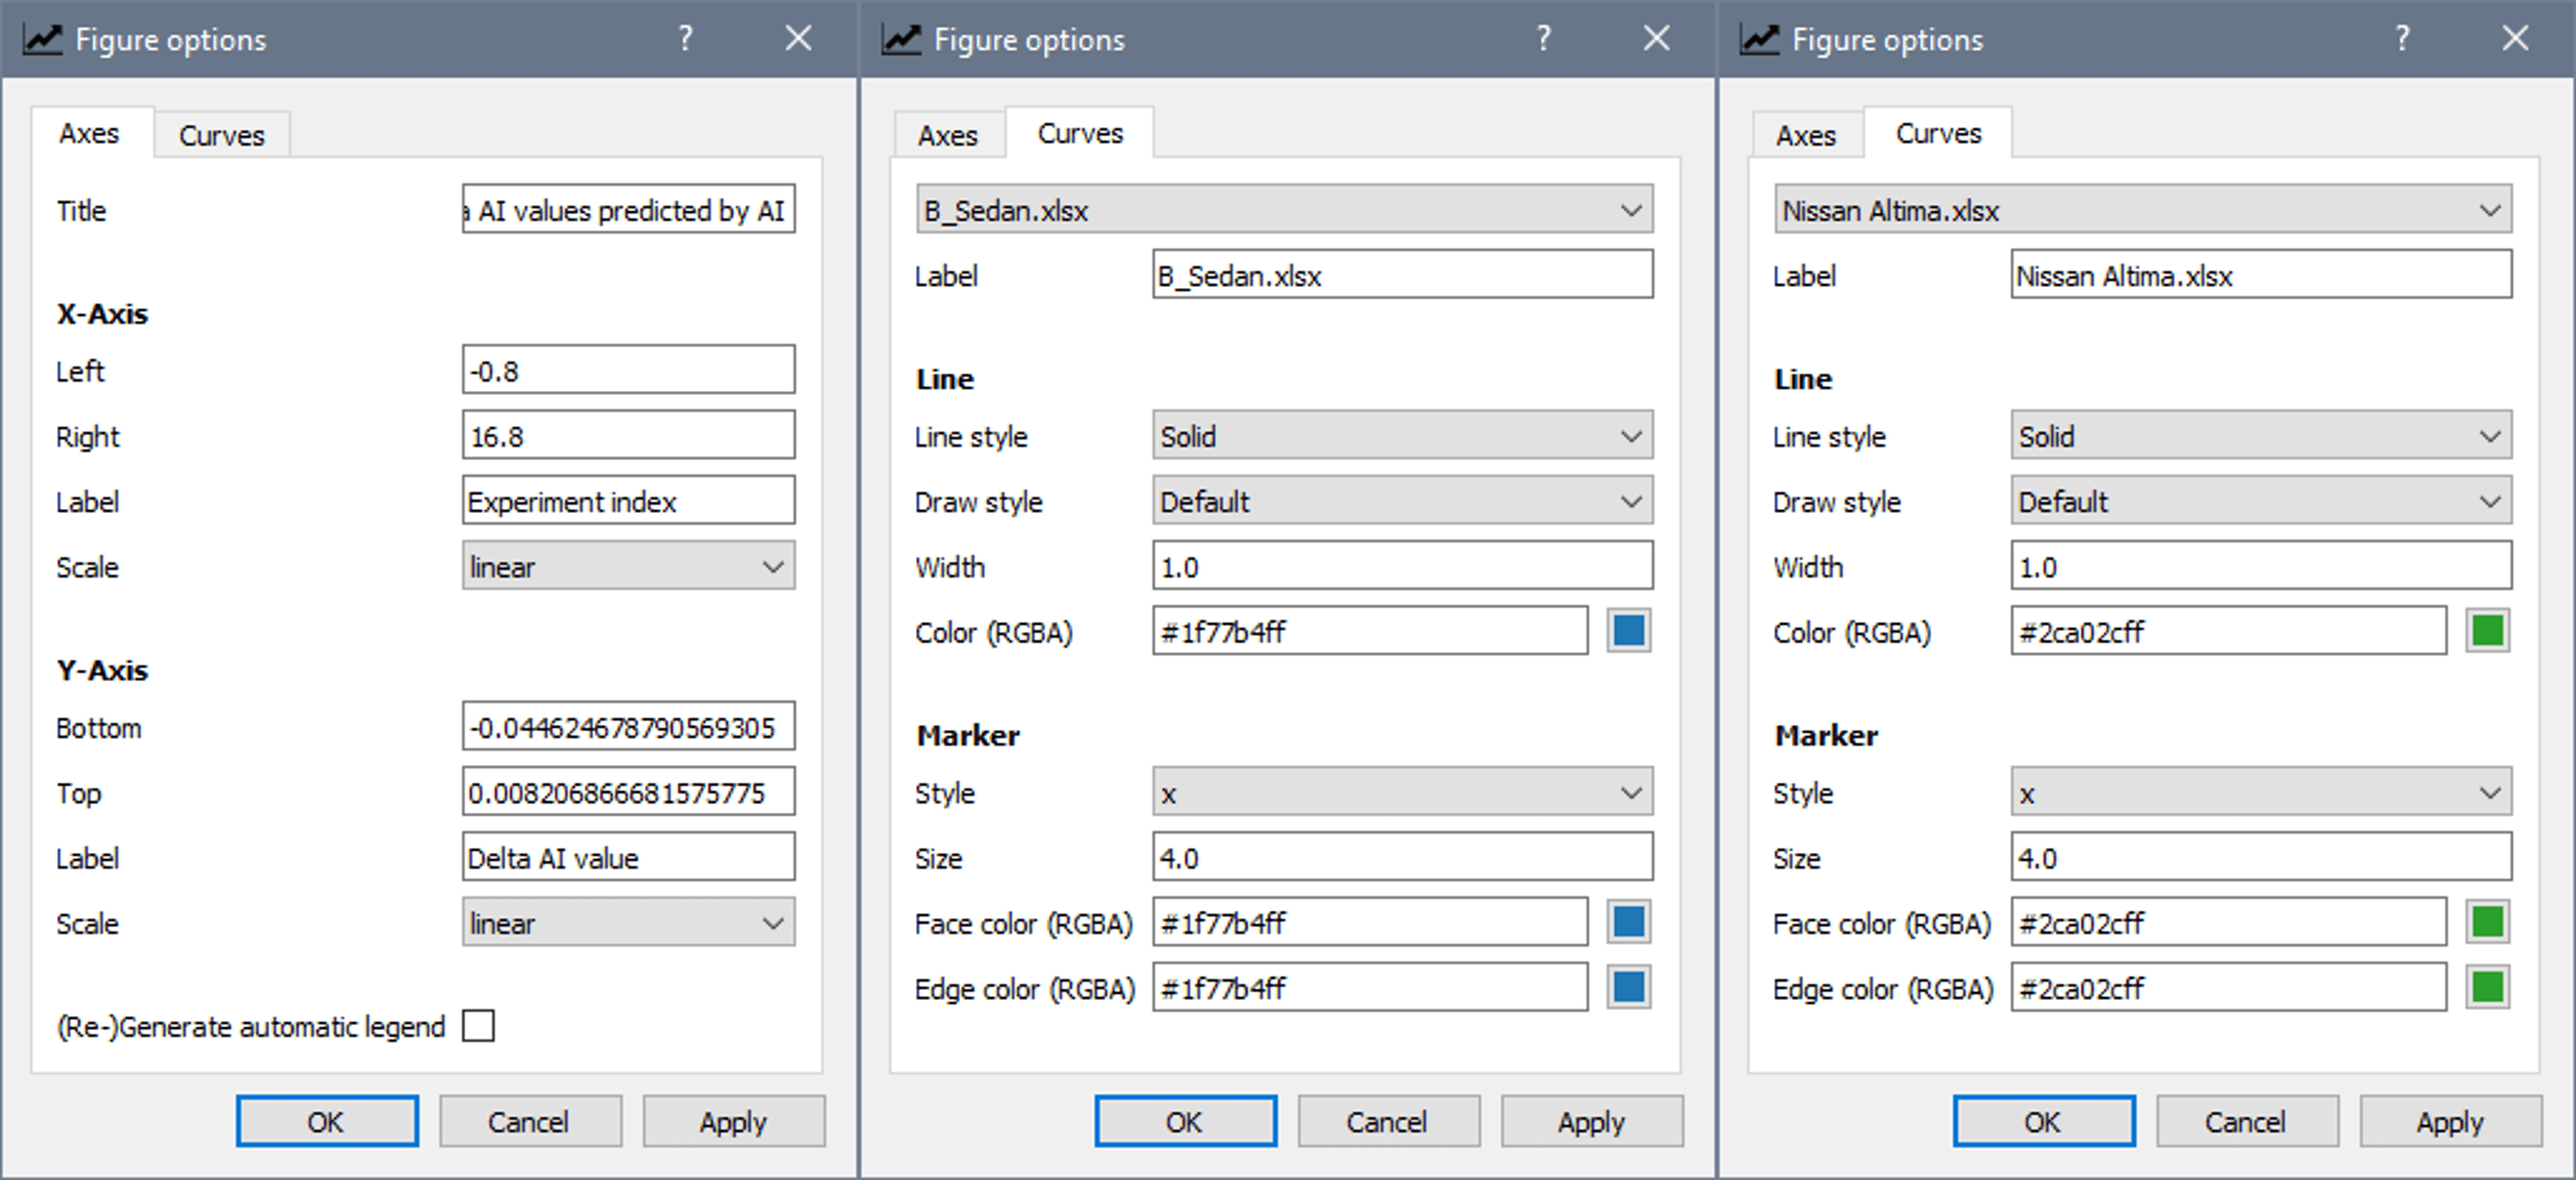
A list of the functions of these output panel toolbar buttons is shown below:
| Button | Explanation |
|---|---|
| Home/Reset | This button resets the view of the plot to its original state. |
| Back | This button allows you to go back to the previous view of the plot. |
| Forward | This button allows you to go forward to the next view of the plot if you have used the Back button previously. |
| Pan/Zoom | This tool allows you to pan and zoom in and out of a plot by clicking and dragging with your mouse. |
| Zoom-to-rect | This tool allows you to zoom in on a specific area of a plot by clicking and dragging your mouse to create a rectangle around that area. |
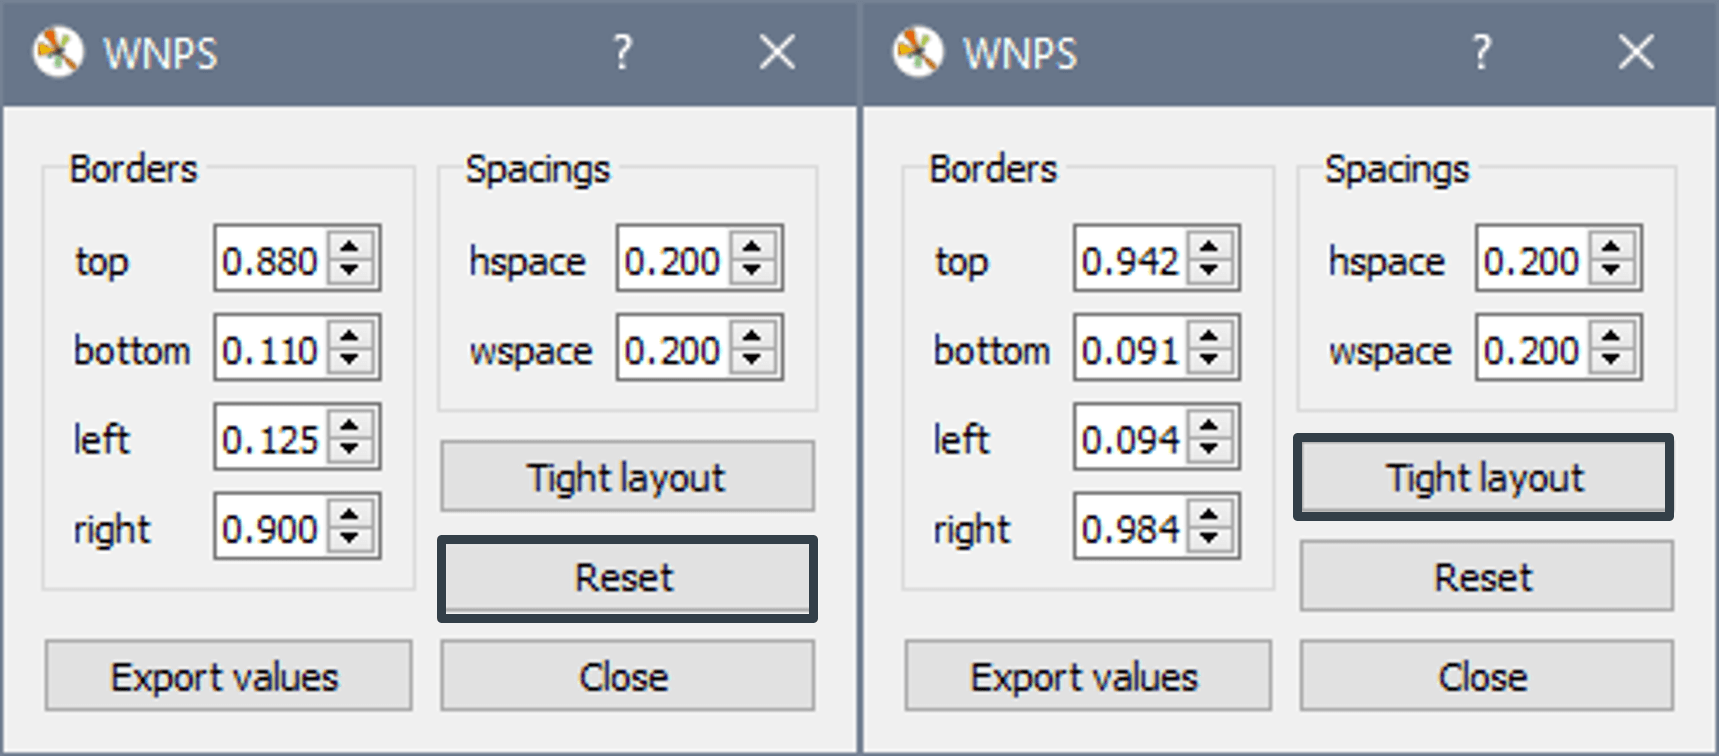
| Figure layout | This tool opens a dialog (Fig 4.3.2) that allows you to adjust the
appearance of subplots within a figure. You can choose the borders and
the padding space. There a button Tightlayout that shrink
the borders. And a reset button to change the layout back
to default. |
| Figure options | This button opens a dialog (Fig 4.3.3) that allows you to edit various properties of a figure. This includes options for line styles, marker styles, and axes properties such as axis limits and scales. You can use this dialog to customize the appearance of your plot and make changes to its visual properties. |
| Save | This button allows you to save a copy of the current view of the plot. |
Among these capabilities are the ability to generate multiple lines of output and clear the existing output panel.
To add a new line of output, users can simply click on the
new_line button located in the Plotting
section of the menu bar. This feature allows engineers to easily compare
the wind noise performance of different configurations and make informed
decisions about vehicle design.
Additionally, users have the ability to clear the existing output
panel with the click of a button. By selecting the
clear_all button located in the Plotting
section of the menu bar, engineers can reset the output panel and
prepare for new experiments. This functionality enhances the efficiency
and productivity of the virtual experiment process, allowing engineers
to quickly move from one experiment to the next without any clutter or
confusion.
4.4. tips
To optimize the use of Wind Noise Prediction Software (WNPS), it is essential to adhere to some best practices and techniques, including:
- Ensure the accuracy and completeness of your input data. Any errors or omissions may negatively impact your prediction results and compromise the reliability of your analysis.
- Utilize the data file input method when comparing multiple experiment statuses. This approach saves time and effort that would otherwise be required for manual entry.
- Visualize the effects of different experiment statuses on AI values by employing a line chart. This enables the identification of the experiment status that yields optimal wind noise performance, thereby enhancing the quality of your predictions.
4.5. Shortcuts
The Wind Noise Prediction Software (WNPS) offers a comprehensive array of shortcuts that can be applied to virtually all functions within the software. By taking advantage of these keyboard shortcuts, engineers can work more efficiently and effectively within the software, ultimately leading to improved results and faster progress in their projects.
| operations | shortcuts |
|---|---|
| Next checkbox | Tab or down |
| Previous checkbox | up |
| Check/uncheck | space |
| input file predict | Shift+Enter |
| new line | \ |
| clear all | Ctrl+x |
| manual input predict | Enter |
| save data | Ctrl+Shift+s |
| save image | Ctrl+s |
4. Machine Learning Techniques used in WNPS
This section briefly explains how the machine learning and data science techniques used by WNPS to analyze former experimental data and conduct wind noise prediction. It also includes a introduction of the different models and algorithms used by WNPS and how they are applied to the data input by the engineer.
Machine learning is a subset of artificial intelligence that involves the development of algorithms and statistical models that can learn from data and make predictions based on patterns. Machine learning has gained widespread popularity in recent years due to its ability to automate data analysis and prediction tasks, which were previously done manually.
4.1 Data Science in WNPS
The first step in using machine learning for wind noise prediction is to collect and preprocess the data. WNPS has a database of experimental data on wind noise generated by different vehicles under various environmental conditions. The data collected includes the vehicle type, wind speed, and other relevant parameters.
The success of wind noise prediction highly depends on the accuracy and quality of input data. As such, data scientists in the WNPS team utilize various data cleansing and analysis techniques to ensure the input data is reliable and consistent.
One of the data cleansing methods commonly used in WNPS is correlation analysis. This method helps to identify any correlations or relationships between different variables in the input data. For example, correlation analysis can reveal if there is a relationship between wind speed and wind noise level. If a strong correlation is found, the WNPS model can take it into account and make more accurate predictions.
Another method used in data cleansing is outlier detection. Outliers are data points that deviate significantly from the rest of the data, and they can have a significant impact on the accuracy of prediction models. Therefore, WNPS data scientists use various techniques to detect and remove outliers from the input data, such as using statistical methods like Z-score and box plots.
Additionally, data normalization and standardization are also used in WNPS. Normalization involves scaling the data to a common range to eliminate the impact of different units or scales. Standardization involves converting the data to a standard normal distribution with a mean of zero and a standard deviation of one. These methods ensure that the input data is consistent and can be analyzed accurately.
4.2 Machine Learning Models in WNPS
After the data has been collected and preprocessed, machine learning algorithms are applied to analyze and predict wind noise propagation paths. WNPS uses supervised learning algorithms, which require labeled data to train statistical models that can predict future wind noise propagation paths. The algorithms used include linear regression, decision trees, and neural networks.
Linear regression is a simple machine learning algorithm that finds the relationship between two variables by fitting a linear equation to the data. In WNPS, linear regression is used to model the relationship between wind speed, wind direction, and AI values, which are used to predict wind noise propagation paths.
Decision trees are another type of machine learning algorithm used in WNPS. Decision trees use a tree-like model to make decisions based on a series of conditions. In WNPS, decision trees are used to model the relationship between various input parameters and the wind noise output.
Finally, neural networks are a more complex type of machine learning algorithm used in WNPS. Neural networks are inspired by the structure and function of the human brain and consist of interconnected nodes that process information. In WNPS, neural networks are used to model the complex relationship between input parameters and wind noise propagation paths.
4.3 Validation and Optimization
After the machine learning models have been developed, they are validated and optimized to ensure that they provide accurate and reliable predictions. This is done by comparing the predicted wind noise values with the actual wind noise generated by the vehicle. The models are then optimized by adjusting the input parameters to minimize the difference between predicted and actual wind noise values.
Metrics such as accuracy, precision, recall, and F1-score are used to measure the performance of our models. In addition, techniques such as cross-validation and hold-out validation are used to estimate the generalization performance of our models. This will help us determine how well our models are likely to perform on new, unseen data.
In conclusion, machine learning is a powerful tool that can be used to predict wind noise propagation paths in vehicles. WNPS uses a combination of supervised learning algorithms, including linear regression, decision trees, and neural networks, to analyze former experimental data and predict wind noise propagation paths. These models are then validated and optimized to ensure that they provide accurate and reliable predictions.
5. Troubleshooting
This section provides solutions or workarounds for common problems or errors that may occur while using WNPS. It also includes FAQs (frequently asked questions) and contact information for technical support.
If you encounter any issues when starting or executing WNPS, try these fist-aid troubleshooting tips first:
- Make sure that your computer meets the minimum system requirements for running WNPS.
- Check that you have installed all required software dependencies.
- If you are using a data file for input, make sure that it is formatted correctly and contains valid data.
- If you are still having issues, consult the user manual or contact technical support for assistance.
5.1. Problems
When using WNPS, it is possible to encounter some common problems or errors that can hinder the prediction process. Some of the common issues and their potential solutions are outlined below:
- WNPS fails to start or crashes: This could be due to several reasons
such as corrupted installation files, incompatible system settings,
insufficient memory space, among others. To resolve this problem, the
following solutions can be attempted:
- Wait for another 5 mins.
- Quit and restart WNPS following Starting and Executing WNPS instructions above.
- Check if your computer meets minimum system requirements for running WNPS.
- Close other applications that may consume memory space before running WNPS.
- Contact technical support if problem persists.
- Prediction process takes too long or fails: This may be caused by
large input data size, network connection issues, server overload etc.
To fix this problem, try these solutions:
- Reduce input data size by selecting fewer experiment statuses or removing unnecessary rows from data file.
- Contact technical support if problem persists.
A list of possible error messages is shown below:
| Error/warning examples | Explanation |
|---|---|
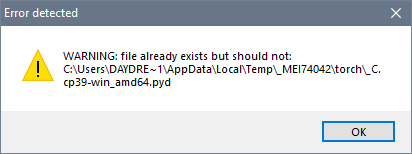 |
Just ignore it, it will not effect starting the program. |
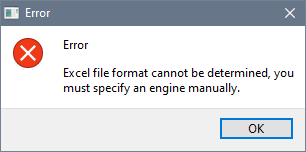 |
The input file is not in Excel format. Choose a valid file format. |
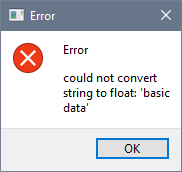 |
The inputted Excel file is in wrong format. Check the example file section to make sure the format is right. |
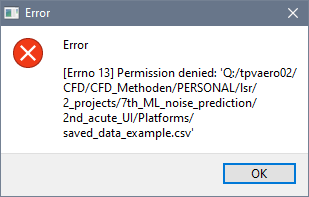 |
The program has not enough permission to write to the csv data file. This happens normally when the destination file is opened somewhere. Close this file then try again. |
5.2. FAQs
Some FAQs (frequently asked questions) about WNPS are:
Q: What is wind noise?
A: Wind noise is a type of noise that is generated by air flow around a vehicle and can affect its acoustic comfort and quality .
Q: What is AI (Articulation Index)?
A: AI (Articulation Index) is a measure of speech intelligibility in noisy environments. It ranges from 0 to 1, where higher values indicate better speech intelligibility.
Q: How does machine learning work in WNPS?
A: Machine learning is a branch of artificial intelligence that uses algorithms to learn from data and make predictions based on patterns. In WNPS, machine learning algorithms are used to analyze former experimental data and predict wind noise propagation paths based on input variables.
Q: Does WNPS require internet access to work?
A: No, WNPS does not require internet access to work. All the necessary files and functions are included in the installation package. However, internet access may be required for software updates and technical support.
Q: Can I use WNPS on a Mac or Linux computer?
A: Yes, WNPS is compatible with Mac and Linux operating systems. Simply download the appropriate version from our website and follow the installation instructions.
Q: How accurate are prediction results from WNPS?
A: Prediction results from WNPS are based on statistical models that have been trained and validated using former experimental data. They are not exact measurements and may have some margin of error depending on input data quality and quantity. They should be used as a reference or a guidance for wind noise performance development, not as a final verdict.
Q: Can WNPS be used for other types of noise prediction besides wind noise?
A: No, WNPS is specifically designed for wind noise prediction in the automotive industry. However, similar machine learning techniques and algorithms can be applied to other types of noise prediction problems in other industries.
Q: How can I provide feedback or suggestions for WNPS?
A: You can provide feedback or suggestions for WNPS by contact the Email below and filling out a feedback form. We appreciate your input and will use it to improve our product.
Thank you for using WNPS! 😊
- How Weather Affects an Outdoor Noise Study | ABD Engineering & Design ↩︎
- Effect of Wind on Sound Transmission | Sciencing ↩︎
- How Weather Affects an Outdoor Noise Study | ABD Engineering & Design ↩︎
- Wind Turbine Noise Propagation | SpringerLink ↩︎
- Interactive navigation — Matplotlib 3.2.2 documentation ↩︎