test GPU servers single GPU
Perform a cross-benchmark on between 8 Tesla A800 GPU server and GeForce RTX 3090. Single GPU performances on the basic matrix operations (Python C++) and real life large-scale neural networks.
Benchmark configuration:
- target:
- Floating point operations per second (FLOPS)
- Bandwidth
- State monitoring
- pcie.link.gen.current
- pcie.link.gen.max
- pstate
- clocks.current.graphics [MHz]
- clocks.max.graphics [MHz]
- accuracy (future)
- Platforms:
- 8 NVIDIA A800s
- GeForce RTX 3090
- Intel® Xeon® Gold 6234 Processor (cpu)
- Implementations:
- Python(PyTorch backended with cuBLAS)
- C++(cuBLAS directly)
- Precisions:
- Float64(double),
- Float32(single)
- Float16(half)
- Tasks (single):
- Basic:
- Matrix matrix multiplication
- Vector multiply a number
- Neural network layer
- Bert
- GPT-2
- T5
- Simulations
- nbody (flowlling blogs)
- SPH
- FVM (suspended)
- Basic:
|
Single GPU cross benchmark |
basic | NN layer | simulation | note | |||||||
|---|---|---|---|---|---|---|---|---|---|---|---|
| GEMM | SCAL | BERT | GPT2 | T5 | nbody | SPH | FVM | ||||
|
A800*8 (w NV) |
torch | FP64 | √ | ||||||||
| FP32 | √ | √# | √ | √ | √ | ||||||
| FP16 | √ | √ | √ | √ | |||||||
| cuda | FP64 | √ | o | √ | |||||||
| FP32 | √ | o | √ | ||||||||
| FP16 | √ | ||||||||||
| 3090 | torch | FP64 | √ | ||||||||
| FP32 | √ | √# | √ | √ | √ | ||||||
| FP16 | √ | √ | √ | √ | |||||||
| cuda | FP64 | √ | o | o | |||||||
| FP32 | √ | o | o | ||||||||
| FP16 | √ | ||||||||||
| cpu | torch | FP64 | √ | ||||||||
| FP32 | √ | √# | |||||||||
| FP16 | |||||||||||
| c++ | FP64 | o | o | o | |||||||
| FP32 | o | o | o | ||||||||
| FP16 | |||||||||||
√ indicates that it FLOPS has been bechmarked, # indicates that it bandwidth has been bechmarked, o indicates that we plan to do benchmarks but need more support. ALL GPU benchmarks are performed under status monitoring.
In the specifications section below, the on-paper performance data is collected and analyzed. In the process section, only python code snippets and partial results are included for illustration and explanation. The full data is in the full report sections.
Specifications
Specifications and other useful information related to the scientific computing performance of the A800, A100, RTX3090, and Xeon® Gold 6234(CPU) are listed below:
| Architecture | Memory (GB) |
ECC | Bandwidth (GB/s) |
CUDA Cores | FP16 Tensor Cores | FP64 GFLOPS | FP32 TFLOPS | FP16 TFLOPS | Compute Capability | PCIE (Gen) |
PCIE (GB/s ) |
NVLink (Gen) |
NVLink (GB/s ) |
|
|---|---|---|---|---|---|---|---|---|---|---|---|---|---|---|
| A100 | Ampere | 80 | √ | 2039 | 6912 | 432 | 19500 | 19.5 | 312 | 8.0 | 4.0 | 2*32 | 3 | 50*12 |
| A800 | Ampere | 80 | √ | 2039 | 6912 | 432 | 19500 | 19.5 | 312 | 8.0 | 4.0 | 2*32 | 3 | 50*8 |
| RTX 3090 | Ampere | 24 | x | 936 | 10496 | 328 | 556 | 35.6 | 142 | 8.6 | 4.0 | 2*16 | 3 | 50*4 |
| Xeon® Gold 6234 | CPU | N/A | √ | N/A | x | x | N/A | 0.2158 | N/A | x | 3.0 | x | x | x |
Data marked as italic is from (unofficial) TechPowerUp GPU Database. See the references list. Data of A4000 marked as orange italic is inaccessible or likely not true. Xeon® Gold 6234 (CPU) is added to this list, only the Geekbench (not the theory) F32 performance of a similar CPU Xeon® Gold 6230 was found. Data of A100 80GB PCIE and A800 80GB PCIE are selected.
| instruction throughput Compute Capability |
5.0, 5.2 | 5.3 | 6.0 | 6.1 | 6.2 | 7.x | 8.0 | 8.6 | 8.9 | 9.0 |
|---|---|---|---|---|---|---|---|---|---|---|
| 16-bit floating-point add, multiply, multiply-add | N/A | 256 | 128 | 2 | 256 | 128 | 2563 | 2563 | 128 | 256 |
| 32-bit floating-point add, multiply, multiply-add | 128 | 128 | 64 | 128 | 128 | 64 | 64 | 128 | 128 | 128 |
| 64-bit floating-point add, multiply, multiply-add | 4 | 4 | 32 | 4 | 4 | 325 | 32 | 2 | 2 | 64 |
[3] 128 for __nv_bfloat16 [5] 2 for compute capability 7.5 GPUs
The TFLOPS in each precision are dependent on the number of CUDA cores, related Tensor Cores, and the instruction throughput.
For A100, the Float64 performance is much better because of its extra Float64 tensor cores and its high instruction throughput. See also why cuBLASHgemm is slower more than cuBLASSgemm when I use? (Because GTX1070 (6.1) has very low throughput for FP16(6.0) The only Pascal GPU with “fast” FP16 currently is P100)
Starting with cuBLAS version 11.0.0, there is no longer any restriction on matrix dimensions and memory alignments to use Tensor Cores. However, the best performance can be obtained using Tensor Cores when the matrix size and pointers meet certain memory alignment requirements. Specifically, all of the following conditions must be met to get the maximum performance from Tensor Cores.
m % 8 == 0k % 8 == 0op_B == cuBLAS_OP_N || n%8 == 0intptr_t(A) % 16 == 0intptr_t(B) % 16 == 0intptr_t(C) % 16 == 0intptr_t(A+lda) % 16 == 0intptr_t(B+ldb) % 16 == 0intptr_t(C+ldc) % 16 == 0
Bandwidth is also a very important factor and is always a key bottleneck in real-life performance. We will see this repeatedly in the next sections. That's why a large bandwidth (fast) memory can be really expensive. In parallel computation, the bandwidth of interconnect interface is more important. Take A40 as an example, the GPU-GPU bandwidth through PCIE can only reach 64 GB/s in the absence of the NVLink. And this speed highly depends on the PCIE configuration of the motherboard. If the motherboard only supports 16 lane PCIE, the bandwidth can only be 32 GB/s. With NVLink, the GPU-to-GPU communication can be much faster, in A40, it can be 112.5GB/s.
 |
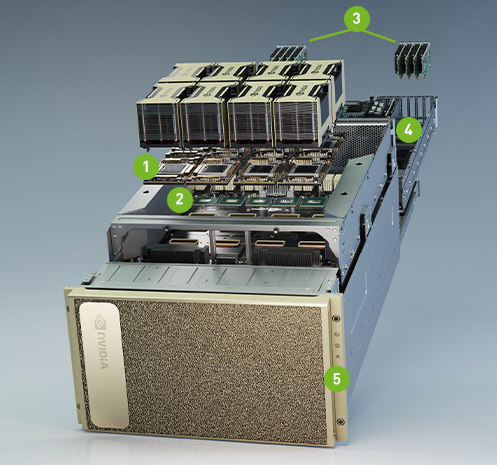 |
Note that NVLink only connects 2 GPUs. In a 4-GPU machine, PCIE is still used for GPUs not connected by NVLink. Another configuration is using NVSwitch + NVLinks to connect multiple cards. For example in above right NVIDIA DGX A10 containing 8x NVIDIA A100 GPUs. 12 NVLinks/GPU provide 600 GB/s GPU-to-GPU Bi-directional Bandwidth. 6x NVIDIA NVSwitches give 4.8 TB/s Bi-directional Bandwidth across all GPUs.
PCIe 4 doubles the data transfer speed of the previous generation (PCIe 3.0) from 1GB/s per lane to 2GB/s per lane, providing users with a total of 32GB/s in a 16 lane configuration. Furthermore, PCIe provides up to 16GT/s per lane when compared to the previous generation's 8GT/s. Each new generation of PCIe doubles the data transfer rate and total bandwidth per lane of the prior generation, paving the way for new, faster PCIe devices.
NVLink is a direct GPU-to-GPU interconnect that scales multi-GPU input/output (IO) within the server. NVSwitch connects multiple NVLinks to provide all-to-all GPU communication at full NVLink speed within a single node and between nodes. NVLink and NVSwitch for NVIDIA Ampere architecture provide extra 600GB/s GPU-to-GPU bandwidth.
Benchmark Process of single GPU
Prerequisites
Create a new conda environment, install PyTorch, hugging face transformer packages from for testing, Jupyter notebook (not required) and pandas.
Preparations
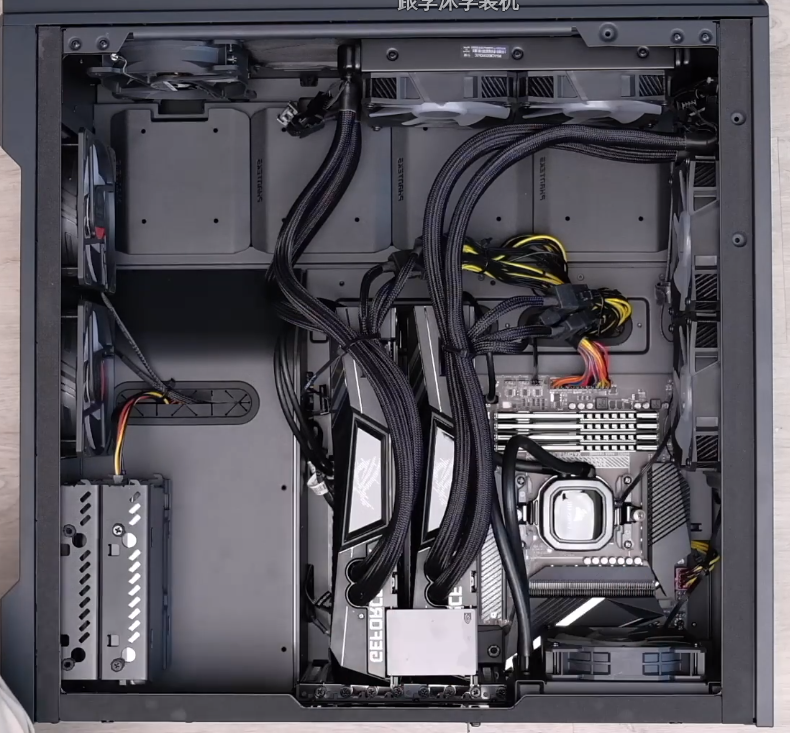
The GPU server (A800), GeForce RTX 3090 on my own computer.
import torch

torch.cuda.set_device(1) # for gpu server

print('Pytorch version\t:', torch.__version__)
print('CUDA version\t:', torch.version.cuda)
print('GPU\t\t:',torch.cuda.get_device_name())| A800 | 3090 |
|
|
Define benchmark functions:
import inspect
from collections import defaultdict
import pandas as pd
from torch.utils import benchmark
pd.options.display.precision = 3
# transfer inspect datatype into dict
def var_dict(*args):
callers_local_vars = inspect.currentframe().f_back.f_locals.items()
return dict([(name, val) for name, val in callers_local_vars if val is arg][0]
for arg in args)
# return the median of mutiple benchmark results
def walltime(stmt, arg_dict, duration=60):
return benchmark.Timer(stmt=stmt, globals=arg_dict).blocked_autorange(
min_run_time=duration).medianMatrix operations
Matrix matrix multiplication (GEMM)
The performance of matrix multiplications represents the upper bound of the hardware.
The matrix multiplication performance is a main topic in HPC. There are a large number of research papers and libraries. For example, for CPU, BLAS(FORTRAN)/cBLAS(C) is one mainstream API containing all Basic Linear Algebra Subprograms and the backend library includes open-sourced ATLAS, OpenBLAS, close-sourced Intel® MKL. For Nvidia GPU, the backend library, cuBLAS, is not open-sourced. You may check cutlass, which claimed similar performance as cuBLAS, for some implementation details. And there is a new coming AI accelerated library openai-gemm only for faster GEMM operations.
The example code of TFLOPS of matrix multiplication is shown below. 4 different sizes of square matrices in 3 different precisions are tested.
matmul_tflops = defaultdict(lambda: {})
for n in [128, 512, 2048, 8192]:
for dtype in (torch.float64, torch.float32, torch.float16):
a = torch.randn(n, n, dtype=dtype).cuda()
b = torch.randn(n, n, dtype=dtype).cuda()
t = walltime('a @ b', var_dict(a, b))
matmul_tflops[f'n={n}'][dtype] = 2*n**3 / t / 1e12 #*
del a, b
pd.DataFrame(matmul_tflops)*The number of floating point operations of
multiplication of two \(n \times n\) matrices: \(2n^3\)
multiplication of two \(n-dimension\) vectors: \(2n^2\)
For example, the inner product of two vectors \(a=[a_0, a_1, ... a_n]\) and \(b=[b_0, b_1, ... b_n]\) can be expanded by: \[<a,b> = a_0*b_0 + a_0*b_1 + a_0*b_2 ... a_n*b_n\] Although in hardware, one multiplication and one addition are done at once, referring as Multiply–accumulate operation (MAC). But normally, they are treated as two separate floating point operations when calculating FLOPs.
A selection of results on different platforms are shown as:
| A800 | n=128 | n=512 | n=2048 | n=8192 | Theory |
|---|---|---|---|---|---|
| Float64 | 0.45773 (+359.49%) | 10.662 (+2430.5%) | 17.188 (+3059.44%) | 18.023 (+3209.95%) | 19.5 (+3407.19%) |
| Float32 | 0.34396 (-12.28%) | 9.7233 (-49.8%) | 17.575 (-34.89%) | 18.993 (-43.89%) | 19.5 (-45.22%) |
| Float16 | 0.20737 (-49.62%) | 18.949 (-30.22%) | 201.77 (+242.0%) | 257.4 (+242.28%) | 312 (+119.72%) |
| 3090 | n=128 | n=512 | n=2048 | n=8192 | Theory |
|---|---|---|---|---|---|
| Float64 | 0.099616 (100.0%) | 0.42134 (100.0%) | 0.54402 (100.0%) | 0.54451 (100.0%) | 0.556 (100.0%) |
| Float32 | 0.3921 (100.0%) | 19.37 (100.0%) | 26.991 (100.0%) | 33.852 (100.0%) | 35.6 (100.0%) |
| Float16 | 0.41158 (100.0%) | 27.157 (100.0%) | 58.997 (100.0%) | 75.201 (100.0%) | 142 (100.0%) |
| cpu | n=128 | n=512 | n=2048 | n=8192 | Standard |
|---|---|---|---|---|---|
| Float64 | 0.0975 (-2.09%) | 0.09918 (-76.46%) | 0.09824 (-81.94%) | 0.09729 (-82.1%) | N/A |
| Float32 | 0.1853 (-52.7%) | 0.2042 (-98.9%) | 0.2080 (-99.2%) | 0.2066 (-99.4%) | 0.216 (-99.4%) |
| Float16 | NAN | NAN | NAN | NAN | N/A |
The general rule can be concluded as:
- the performance increases with the matrix size i.e. occupancy.
- a big performance jump is seen when converting from 64-bit floating points to 32-bit floating points, and from 32-bit floating points to 16-bit floating points.
- the best TFLOPS number ever got is still far away from the theoretical TFLOPS. Because the performance is bottlenecked by the memory bandwidth.
From the comparison, we can see that:
- For A800:
- it has much higher FLoat64 and Float16 FLOPS than the others
- the Float32 performance is slightly lower, stick to the theory.
Vector multiply a number (SCAL)
The number of computations (FLOPs) is only part of the story. Memory bandwidth is the other part, and most of the time is even more important! On current computer architectures, a single memory access from main memory is much slower than a single computation — by a factor of about 100 or more. As a result, the amount of memory read/writes will have a big impact on the speed — bigger perhaps than the FLOPs.
In order to test the bandwidth, we designed a task that scales a vector by a constant. The actual scaling operation is as fast as a snap. The main bottleneck is the bandwidth.
Element-wised tasks like this are very common, such as the time integrating step in simulations, the activation function layer and model updating process in Neural Networks. Such types of tasks are always ignored when calculating the complexity (FLOPs). But they can be actually very slow.
It’s actually common to not count these operations, as they only take up a small fraction of the overall time. We’re mostly interested in the (big) matrix multiplies and dot products, and we’ll simply assume that the activation function is free.
We only test on torch (code below) to illustrate the problem. And we only choose precision FP32, because the calculation overhead of large dimension FP64 vector is still big. We are seeking an operation with ignorable calculation overhead compare to the memory access. Besides, FP16 scaling is not supported in cuBLAS, neither level-1 routine cuBLASscal nor BLAS-like routine cuBLASScalEx().
For a more detailed pure bandwidth benchmark, refer to the beginning section of next blog.
vector = defaultdict(lambda: {})
for n in [1024*64, 1024*256, 1024*1024, 1024*1024*4]:
a = torch.randn(n).cuda()
t = walltime('a * 1.2', var_dict(a))
vector[n]['TFLOPS'] = n / t / 1e12
vector[n]['GB/s'] = 8 * n / t / 1e9 # **
pd.DataFrame(vector)**The size of \(n\) dimensional Float32 vector is \(4n\) bits. In one scaling operation, each element of the vectors need to be distributed to each thread, and moved back to the main memory after computing.
In a storing dense task like this, assuming the time spend on operating is much lower than storing, the bandwidth is therefore \(8n/t\) bits/s.
| A800 | n=65536 | n=262144 | n=1048576 | n=4194304 | Peak | Theory |
|---|---|---|---|---|---|---|
| F32 TFLOPS | 0.0081949 | 0.033527 | 0.13034 | 0.21234 | 18.993 | 19.5 |
| Bandwidth (GB/s) |
65.559 (-19.37%) | 268.22 (-20.5%) | 1042.7 (+19.53%) | 1698.7 (+114.33%) | N/A | 2039 (+117.8%) |
| RTX3090 | n=65536 | n=262144 | n=1048576 | n=4194304 | Peak | Theory |
|---|---|---|---|---|---|---|
| F32 TFLOPS | 0.010163 | 0.042172 | 0.10904 | 0.09907 | 33.852 | 35.6 |
| Bandwidth (GB/s) |
81.306 (100.0%) | 337.38 (100.0%) | 872.31 (100.0%) | 792.56 (100.0%) | N/A | 936 (100.0%) |
| CPU | n=65536 | n=262144 | n=1048576 | n=4194304 | Peak | Standard |
|---|---|---|---|---|---|---|
| F32 TFLOPS | 0.0068965 | 0.0024492 | 0.002599 | 0.0021311 | 0.2066 | 0.216 |
| Bandwidth (GB/s) |
55.172 (-32.14%) | 19.594 (-94.19%) | 20.792 (-97.62%) | 17.048 (-97.85%) | N/A | N/A |
The TFLOPS is way far from the peak performance even with large vector size.
From the comparison, the bandwidth of A800 has as much as +114.33% gain from the 3090.
GPU state monitoring
This task is firstly designed for a wired bug when running GEMM with CUDA. It is not surprising that running cuBLAS directly gives better peak results than the indirect approach i.e. torch calling cuBLAS. However, there is a large drop in performance for Float32, RTX3090, CUDA compared to its torch counterparts. And this result is repeatable.
To check the reason, run the same GEMM benchmark again with CUDA and torch on Float32, RTX3090 while recording the GPU state, the result is shown below:
================== CUDA ==================
INFO: Running test for all 1 GPU deivce(s) on host tehp1308
==================
INFO: testing GPU0
==================
timestamp, index, name, pcie.link.gen.current, pcie.link.gen.max, pstate, clocks.current.graphics [MHz], clocks.max.graphics [MHz]
2022/12/22 14:26:29.629, 0, GeForce RTX 3090, 1, 3, P8, 210 MHz, 2100 MHz
2022/12/22 14:26:34.631, 0, GeForce RTX 3090, 3, 3, P2, 1695 MHz, 2100 MHz
2022/12/22 14:26:39.633, 0, GeForce RTX 3090, 3, 3, P2, 1695 MHz, 2100 MHz
2022/12/22 14:26:44.635, 0, GeForce RTX 3090, 3, 3, P2, 1575 MHz, 2100 MHz
2022/12/22 14:26:49.636, 0, GeForce RTX 3090, 3, 3, P2, 1530 MHz, 2100 MHz
2022/12/22 14:26:54.638, 0, GeForce RTX 3090, 3, 3, P2, 1440 MHz, 2100 MHz
2022/12/22 14:26:59.640, 0, GeForce RTX 3090, 3, 3, P2, 1515 MHz, 2100 MHz
2022/12/22 14:27:04.643, 0, GeForce RTX 3090, 3, 3, P2, 1485 MHz, 2100 MHz
cuBLASSgemm test result:
8.5635e-07
1.6361e-05
0.00013088
0.0010519
0.0085015
0.081756
0.29769
2.6873
9.7986
12.518
18.074
16.447
20.891
20.691================== TORCH ==================
INFO: Running test for all 1 GPU deivce(s) on host tehp1308
==================
INFO: testing GPU0
==================
timestamp, index, name, pcie.link.gen.current, pcie.link.gen.max, pstate, clocks.current.graphics [MHz], clocks.max.graphics [MHz]
2022/12/22 14:42:38.925, 0, GeForce RTX 3090, 1, 3, P8, 255 MHz, 2100 MHz
2022/12/22 14:42:43.927, 0, GeForce RTX 3090, 3, 3, P2, 1695 MHz, 2100 MHz
2022/12/22 14:42:48.929, 0, GeForce RTX 3090, 3, 3, P2, 1950 MHz, 2100 MHz
2022/12/22 14:42:53.930, 0, GeForce RTX 3090, 3, 3, P2, 1950 MHz, 2100 MHz
2022/12/22 14:42:58.931, 0, GeForce RTX 3090, 3, 3, P2, 1950 MHz, 2100 MHz
2022/12/22 14:43:03.933, 0, GeForce RTX 3090, 3, 3, P2, 1950 MHz, 2100 MHz
2022/12/22 14:43:08.934, 0, GeForce RTX 3090, 3, 3, P2, 1935 MHz, 2100 MHz
2022/12/22 14:43:13.950, 0, GeForce RTX 3090, 3, 3, P2, 1890 MHz, 2100 MHz
2022/12/22 14:43:18.952, 0, GeForce RTX 3090, 3, 3, P2, 1800 MHz, 2100 MHz
2022/12/22 14:43:23.953, 0, GeForce RTX 3090, 3, 3, P2, 1740 MHz, 2100 MHz
2022/12/22 14:43:28.954, 0, GeForce RTX 3090, 3, 3, P2, 1695 MHz, 2100 MHz
2022/12/22 14:43:33.956, 0, GeForce RTX 3090, 3, 3, P2, 1935 MHz, 2100 MHz
Pytorch version : 1.8.0+cu111
CUDA version    : 11.1
GPU             : GeForce RTX 3090
8.5315e-07
1.6369e-05
0.00013096
0.0010552
0.0084168
0.06718
0.39649
2.9674
20.268
27.827
29.288
35.074
35.671
31.058We can see except for the beginning moment, the range of GPU frequencies are:
- cuBLAS: [1485, 1695] MHz
- torch: [1695, 1950] MHz
The peak frequency when running cuBLAS directly is the same as the lowest frequency when running torch!
Check the benchmark logs of A800,
================== CUDA ==================
Running test for all 8 GPU deivce(s) on host localhost.localdomain

==================
testing GPU0
==================
timestamp, index, name, pcie.link.gen.current, pcie.link.gen.max, pstate, clocks.current.graphics [MHz], clocks.max.graphics [MHz]
2023/02/13 00:46:32.488, 0, NVIDIA A800-SXM4-80GB, 4, 4, P0, 210 MHz, 1410 MHz
2023/02/13 00:46:37.491, 0, NVIDIA A800-SXM4-80GB, 4, 4, P0, 1155 MHz, 1410 MHz
2023/02/13 00:46:42.495, 0, NVIDIA A800-SXM4-80GB, 4, 4, P0, 1155 MHz, 1410 MHz
2023/02/13 00:46:47.496, 0, NVIDIA A800-SXM4-80GB, 4, 4, P0, 1155 MHz, 1410 MHz
2023/02/13 00:46:52.938, 0, NVIDIA A800-SXM4-80GB, 4, 4, P0, 1155 MHz, 1410 MHz
2023/02/13 00:46:57.940, 0, NVIDIA A800-SXM4-80GB, 4, 4, P0, 1155 MHz, 1410 MHz
2023/02/13 00:47:02.941, 0, NVIDIA A800-SXM4-80GB, 4, 4, P0, 1155 MHz, 1410 MHz
2023/02/13 00:47:07.943, 0, NVIDIA A800-SXM4-80GB, 4, 4, P0, 1155 MHz, 1410 MHz
2023/02/13 00:47:12.944, 0, NVIDIA A800-SXM4-80GB, 4, 4, P0, 1155 MHz, 1410 MHz
2023/02/13 00:47:18.320, 0, NVIDIA A800-SXM4-80GB, 4, 4, P0, 1155 MHz, 1410 MHz
2023/02/13 00:47:23.321, 0, NVIDIA A800-SXM4-80GB, 4, 4, P0, 1410 MHz, 1410 MHz
2023/02/13 00:47:28.425, 0, NVIDIA A800-SXM4-80GB, 4, 4, P0, 1410 MHz, 1410 MHz
2023/02/13 00:47:33.427, 0, NVIDIA A800-SXM4-80GB, 4, 4, P0, 1410 MHz, 1410 MHz
2023/02/13 00:47:38.428, 0, NVIDIA A800-SXM4-80GB, 4, 4, P0, 1410 MHz, 1410 MHz
2023/02/13 00:47:43.879, 0, NVIDIA A800-SXM4-80GB, 4, 4, P0, 1410 MHz, 1410 MHz
2023/02/13 00:47:48.880, 0, NVIDIA A800-SXM4-80GB, 4, 4, P0, 1410 MHz, 1410 MHz
2023/02/13 00:47:53.953, 0, NVIDIA A800-SXM4-80GB, 4, 4, P0, 1410 MHz, 1410 MHz
2023/02/13 00:47:58.955, 0, NVIDIA A800-SXM4-80GB, 4, 4, P0, 1410 MHz, 1410 MHz
2023/02/13 00:48:03.957, 0, NVIDIA A800-SXM4-80GB, 4, 4, P0, 1410 MHz, 1410 MHz
2023/02/13 00:48:08.959, 0, NVIDIA A800-SXM4-80GB, 4, 4, P0, 1410 MHz, 1410 MHz
2023/02/13 00:48:13.962, 0, NVIDIA A800-SXM4-80GB, 4, 4, P0, 1410 MHz, 1410 MHz
No major problem is found.
Below are some more information extracted from the GPU state comparison when running GEMM:
| pcie state | pstate | freq | freq stability | |
|---|---|---|---|---|
| A800 | 4/4 | 8-0 | 1410/1410 MHZ | high |
| RTX3090 | 3/3 | 8-2 | 1950/2100 MHz | low |
It is worth mentioning that, although the max frequencies of A800 is not comparable with that of RTX3090, the frequency of them stick to the maximum during the entire period of calculation. On the contrary, the frequencies of RTX3090 reaches their peak performances, lower than the max frequency, for a short time then deteriorates because of their less heat dissipation capabilities.
Also, the pstate represents to the current performance state of GPU, ranging from P0 max to P12 min. A800 immediately reaches P0 but RTX3090 only reach P2. Maybe that's why the frequency of RTX3090 never reach the highest. There is a way of forcing the graphic card to be P0 state is a kind of overclock, which can cause a crash, I did not try it. See Issues with P-state "--pstate p0" on 3080ti & 0.24.8.
Last but not least, note that A800 has a higher PCIE state than RTX3090. In fact, RTX3090 supports PCIE 4.0, but the connected CPU and motherboard only supports PCIE 3.0. See Intel® Xeon® Gold 6234 Processor. This means that the A800 has twice the CPU-GPU bandwidth of the RTX3090 per PCIE lane. This is a benefit for multi-GPU computing, especially in the absence of NVLink.
Large scale neural networks
Now, test the performance of a series of large scale transformer neural networks[1], then split it into pieces to analysis the performance of each kernel.
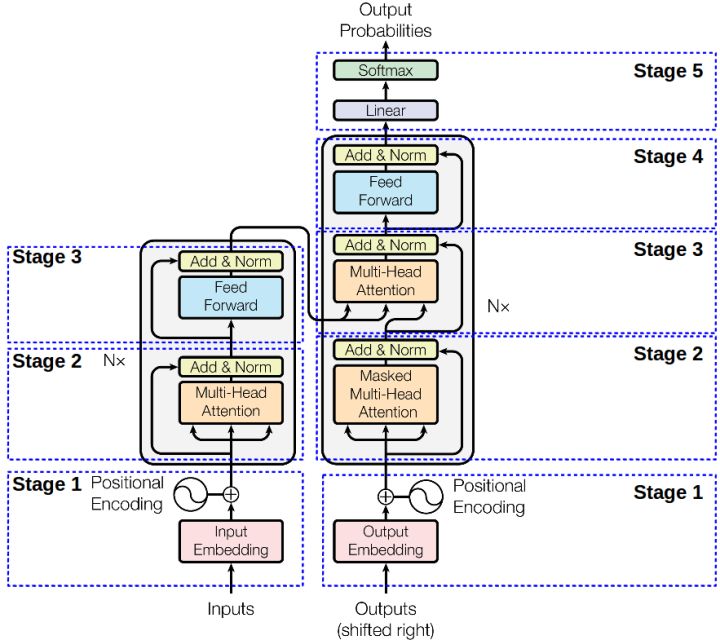
The original interpretation of transformer is a encode-decode structure containing several transformer blocks. Each transformer block contains one (or two in decoder block) multi-head attention layer and a feed forward layer (with residual connection and layer norm layers) as shown below.
Define a function to benchmark both forward and forward with backward performance using different sequence lengths and batch sizes:
def layer_benchmark(layer, hidden_size, seq_lens, batch_sizes, cross_attention=False):
    h = hidden_size
    results = defaultdict(lambda: {})
    encoder_state = 'encoder_hidden_states=X' if cross_attention else ''
    for s in seq_lens:
        for b in batch_sizes:
            ffn = 16*b*s*h*h / 1e12  # TFLOPS for the Feed-Forward Network
            atten = (4*b*h*s*s + 8*b*s*h*h) / 1e12  # TFLOPS for attention
            forward = ffn + (2 if cross_attention else 1) * atten

            X = torch.randn(b, s, h).half().cuda()
            results[f'batch={b}'][f'fwd seq_len={s}'] = forward / walltime(
                f'layer(X, {encoder_state})', var_dict(layer, X))
            results[f'batch={b}'][f'fwd+bwd seq_len={s}'] = 3 * forward / walltime(
                f'layer(X, {encoder_state})[0].sum().backward()', var_dict(layer, X))
    return pd.DataFrame(results)
Bert
The architecture of BERT[2] is a multi-layer bidirectional transformer encoder (stage 1-3 in the image above). There are two types of BERT:
- BERT Base, 12 (Nx) transformer (encoder) blocks, 12 attention heads, and 110 million parameters
- BERT Large, 24 (Nx) transformer (encoder) blocks, 16 attention heads and 340 million parameters
BERT large is adopted in this test. The hidden size is 1024, sequence length is chosen from [128, 512], and selected batch sizes are [4, 16, 32, 64], the result is shown below:
print(layer_benchmark(layer, config.hidden_size, [128, 512], [4, 16, 32, 64]).to_markdown())| A800_0 | batch=4 | batch=16 | batch=32 | batch=64 |
|---|---|---|---|---|
| fwd seq_len=128 |
19.2772 (+8.7%) | 73.497 (+98.49%) | 111.482 (+194.8%) | 117.696 (+194.67%) |
| fwd+bwd seq_len=128 |
16.5694 (-30.17%) | 88.1707 (+192.16%) | 107.347 (+150.18%) | 135.874 (+197.25%) |
| fwd seq_len=512 |
77.2078 (+139.87%) | 94.9238 (+171.26%) | 97.682 (+171.89%) | 101.759 (+178.88%) |
| fwd+bwd seq_len=512 |
50.4813 (+57.09%) | 111.566 (+179.85%) | 117.27 (+183.52%) | 122.327 (+188.88%) |
| 3090 | batch=4 | batch=16 | batch=32 | batch=64 |
|---|---|---|---|---|
| fwd seq_len=128 |
17.7345 (100.0%) | 37.0276 (100.0%) | 37.8156 (100.0%) | 39.9415 (100.0%) |
| fwd+bwd seq_len=128 |
23.729 (100.0%) | 30.1785 (100.0%) | 42.9077 (100.0%) | 45.7111 (100.0%) |
| fwd seq_len=512 |
32.1873 (100.0%) | 34.9941 (100.0%) | 35.9264 (100.0%) | 36.4884 (100.0%) |
| fwd+bwd seq_len=512 |
32.1356 (100.0%) | 39.8661 (100.0%) | 41.3627 (100.0%) | 42.3451 (100.0%) |
No surprise that a large batch size helps. But the best TFLOPS number is below the matrix multiplication TFLOPS.
In order to see the reason, take A40_0 and inspect the performance on each part of a BERT layer. The hidden size is 1024, sequence length is 128, and batch size is 64.
h, b, s = config.hidden_size, 64, 128
X = torch.randn(b, s, h).half().cuda()

print('Dense layer TFLOPS: %.3f' % (8*b*s*h*h / 1e12 / walltime(
    'layer.intermediate.dense(X)', var_dict(layer, X))))

print('Dense+Activation TFLOPS: %.3f' % (8*b*s*h*h / 1e12 / walltime(
    'layer.intermediate(X)', var_dict(layer, X))))

ffn = 16*b*s*h*h / 1e12
print('FFN TFLOPS: %.3f'%(ffn / walltime(
    'layer.output(layer.intermediate(X),X)', var_dict(layer, X))))

att = (4*b*h*s*s + 8*b*s*h*h) / 1e12
print('Attention TFLOPS: %.3f'%(
    att / walltime('layer.attention(X)', var_dict(layer, X))))

print(att / ffn)
Dense layer TFLOPS: 95.531
Dense+Activation TFLOPS: 73.538
FFN TFLOPS: 72.570
Attention TFLOPS: 37.845
0.53125We first benchmark the first dense layer in the Feed-Forward Network (FFN) layer. The number of TFLOPS is quite good, 95.510, with a peak GEMM TFLOPS of 101.26.
Then run this dense layer with the GeLU activation. Even though the activation function has a negligible complexity (n), it reduces the TFLOPS. The reason is that the elemental-wise operation of the activation function is bounded by the memory bandwidth.
Then we test the entire FFN, including the residual block and normalization and the TFLOPS number gains a little bit.
The other part of the BERT layer is the multi-head self-attention. Even though the main computation part of the attention block is still matrix multiplication, it has more memory constrained operators compared to FFN. So we see a lower TFLOPS.
GPT-2
Instead of encoder, GPT-2[2] takes the decoder part of the original transformer architecture. GPT-2 Medium is used for
- GPT-2 small, 12 (Nx) transformer (decoder) blocks, 117 million parameters
- GPT-2 medium, 24 (Nx) transformer (decoder) blocks, 345 million parameters
- GPT-2 large, 36 (Nx) transformer (decoder) blocks, 762 million parameters
- GPT-2 XL, 48 (Nx) transformer (decoder) blocks, 1542 million parameters
GPT-2 medium is adopted in this test, with a equivalent size to BERT large. Hidden size is 1024 as well, but GPT-2 is trained with a 1024 sequence length.
| A800_0 | batch=4 | batch=16 | batch=32 | batch=64 |
|---|---|---|---|---|
| fwd seq_len=512 |
58.4751 (+125.14%) | 65.4225 (+136.48%) | 68.0979 (+150.45%) | 69.3883 (+154.31%) |
| fwd+bwd seq_len=512 |
49.0019 (+86.13%) | 76.031 (+148.75%) | 78.9392 (+157.0%) | 80.8344 (+168.09%) |
| fwd seq_len=1024 |
49.5448 (+121.18%) | 52.8486 (+125.33%) | 53.5561 (+137.26%) | 53.6964 (+142.32%) |
| fwd+bwd seq_len=1024 |
57.3693 (+131.83%) | 63.1987 (+140.25%) | 64.1421 (+144.76%) | 64.4187 (+141.87%) |
| 3090 | batch=4 | batch=16 | batch=32 | batch=64 |
|---|---|---|---|---|
| fwd seq_len=512 |
25.973 (100.0%) | 27.6646 (100.0%) | 27.19 (100.0%) | 27.2853 (100.0%) |
| fwd+bwd seq_len=512 |
26.3274 (100.0%) | 30.5657 (100.0%) | 30.716 (100.0%) | 30.1517 (100.0%) |
| fwd seq_len=1024 |
22.4006 (100.0%) | 23.4543 (100.0%) | 22.573 (100.0%) | 22.1597 (100.0%) |
| fwd+bwd seq_len=1024 |
24.7468 (100.0%) | 26.305 (100.0%) | 26.2063 (100.0%) | 26.634 (100.0%) |
As we can see, despite GPT-2 and BERT has the same complexity, GPT-2 has worse TFLOPS when using the same batch size and sequence length. And the performance of 3090 nearly reach A40. Also, using a larger sequence length 1024 further harms the performance.
T5
T5[2] takes the full transformer architecture. The encoder and decoder performance are tested separately. The performance of encoder is similar to BERT. The decoder has an additional cross attention, which increases the time complexity and also hurts TFLOPS.
| A800_0 | batch=4 | batch=16 | batch=32 | batch=64 |
|---|---|---|---|---|
| fwd encoder |
38.8697 (+74.31%) | 57.0796 (+123.16%) | 59.3724 (+126.56%) | 61.1527 (+130.66%) |
| fwd+bwd encoder |
40.6477 (+71.46%) | 70.3433 (+139.4%) | 75.9491 (+150.57%) | 78.273 (+148.64%) |
| fwd decoder |
31.965 (+64.45%) | 46.5513 (+114.58%) | 48.3616 (+112.88%) | 49.7627 (+118.77%) |
| fwd+bwd decoder |
33.5017 (+62.1%) | 59.5139 (+128.58%) | 62.4874 (+132.72%) | 64.1493 (+134.82%) |
| 3090 | batch=4 | batch=16 | batch=32 | batch=64 |
|---|---|---|---|---|
| fwd encoder |
22.2991 (100.0%) | 25.5779 (100.0%) | 26.206 (100.0%) | 26.5121 (100.0%) |
| fwd+bwd encoder |
23.7068 (100.0%) | 29.3832 (100.0%) | 30.3106 (100.0%) | 31.4801 (100.0%) |
| fwd decoder |
19.4381 (100.0%) | 21.6942 (100.0%) | 22.7182 (100.0%) | 22.7463 (100.0%) |
| fwd+bwd decoder |
20.6679 (100.0%) | 26.0369 (100.0%) | 26.8509 (100.0%) | 27.3184 (100.0%) |
In conclusion, to achieve the best performance for a Transformer layer, we need to use a fast data type and a large batch size. For further improvement, we may need to rewrite the code. For example, fusing multiple kernels into a single one.
Future
The accuracy is not checked in this benchmark.
Note the memory of A800 is externally equipped with ECC compared with 3090. Theoretically, the accuracy of A800 is better than 3090.
A800 GPU Memory 80 GB GDDR6 with error-correcting code (ECC) 3090 Memory Type GDDR6X The FLOPS of particles method remain unknown, the benchmark of it is suspended.
Multiple GPU performance will be tested in next blog.
References
https://www.viperatech.com/product/nvidia-a800-customer-deck/
NVIDIA A40 PCIe Specs | TechPowerUp GPU Database
Quadro RTX 8000 Specs | TechPowerUp GPU Database
NVIDIA GeForce RTX 3090 Specs | TechPowerUp GPU Database
NVIDIA RTX A4000 Specs | TechPowerUp GPU Database
NVIDIA A100 PCIe 80 GB Specs | TechPowerUp GPU Database
PCIe 4.0 (Ultimate Guide to Understanding PCI Express Gen ...
NVLink & NVSwitch:Advanced Multi-GPU Systems | NVIDIA
DGX A100 : Universal System for AI Infrastructure
BLAS (Basic Linear Algebra Subprograms)
Automatically Tuned Linear Algebra Software (ATLAS)
OpenBLAS : An optimized BLAS library
Get Started with Intel® oneAPI Math Kernel Library
GitHub - openai/openai-gemm: Open single and half …
cuBLAS Level-3 Function Reference
Matrix Multiplication Background User's Guide - NVIDIA
Multiply–accumulate operation (MAC), wikipedia
fusing pointwise operations, PyTorch tutorials
How fast is my model? - Machine, Think
BERT Explained | Papers With Code
GPT-2 Explained | Papers With Code
T5 Explained | Papers With Code
why cuBLASHgemm is slower more than cuBLASSgemm when I use?
Issues with P-state "--pstate p0" on 3080ti & 0.24.8.
Intel® Xeon® Gold 6234 Processor
Intel® Xeon® Gold 6330 Processor
Intel Xeon Gold GFLOPS performance
- Vaswani, A., Shazeer, N., Parmar, N., Uszkoreit, J., Jones, L., Gomez, A. N., ... & Polosukhin, I. (2017). Attention is all you need. Advances in neural information processing systems, 30. ↩︎
- Devlin, J., Chang, M. W., Lee, K., & Toutanova, K. (2018). Bert: Pre-training of deep bidirectional transformers for language understanding. arXiv preprint arXiv:1810.04805. ↩︎
- Radford, A., Wu, J., Child, R., Luan, D., Amodei, D., & Sutskever, I. (2019). Language models are unsupervised multitask learners. OpenAI blog, 1(8), 9. ↩︎
- Raffel, C., Shazeer, N., Roberts, A., Lee, K., Narang, S., Matena, M., ... & Liu, P. J. (2020). Exploring the limits of transfer learning with a unified text-to-text transformer. J. Mach. Learn. Res., 21(140), 1-67. ↩︎
- Choi, Y. R., & Stegailov, V. (2022). Multi-GPU GEMM Algorithm Performance Analysis for Nvidia and AMD GPUs Connected by NVLink and PCIe. In International Conference on Mathematical Modeling and Supercomputer Technologies (pp. 281-292). Springer, Cham. ↩︎